Yuping Chunhui Society (玉屏春晖社), Yuping, Guizhou, China
Abstract
Surface water quality in China is classified under GB3838-2002, which excludes total nitrogen (TN) from river water-quality assessment on the grounds that TN limits in the standard were designed for lakes and reservoirs. Whether this exclusion systematically masks nitrogen pollution in rivers—China’s primary drinking-water source—remains unknown. Here we analyse 141,504 hourly monitoring records from 37 national control stations across three major Yangtze tributaries (Min, Jialing and Han rivers) covering 2021–2025. Under the official river five-indicator standard (pH, dissolved oxygen, permanganate index, ammonia nitrogen, total phosphorus), 99.1% of 545 station-quarter observations meet grades I–III, with zero inferior-grade-V events. Including TN collapses this rate to 8.3%, and TN becomes the dominant pollutant in every one of 48 river-quarters. Seasonal analysis reveals a striking decoupling: TN remains nearly invariant across seasons (1.70–1.78 mg L⁻¹, seasonal amplitude 5%), whereas total phosphorus (TP), turbidity and permanganate index rise sharply in the flood season, indicating that TN is governed by constant point-source inputs while TP tracks sediment-driven non-point sources. Critically, TP–turbidity coupling differs dramatically across rivers (Han ρ = 0.83, Jialing ρ = 0.60, Min ρ = 0.17), revealing fundamentally different nutrient transport regimes within a single basin. These findings expose a systemic blind spot in China’s river water-quality assessment and demonstrate that a one-size-fits-all nutrient management strategy is inappropriate; river-specific nitrogen standards and differentiated source-control measures are urgently needed.
Keywords: total nitrogen · water quality assessment · Yangtze River · nutrient transport · seasonal decoupling · GB3838-2002
Introduction
China has invested heavily in surface-water protection over the past two decades, and official reports show that the proportion of national monitoring sections meeting water-quality grades I–III reached 90.4% in 2024, up from 84.9% in 2021¹. This headline indicator underpins national policy evaluation and public trust in environmental governance. Yet the assessment framework itself contains a long-standing ambiguity: in the Environmental Quality Standard for Surface Water (GB3838-2002)², the total nitrogen (TN) column is explicitly annotated “(lakes and reservoirs, as N)”, and TN limits are routinely excluded from river water-quality classification³. The rationale is that TN was historically elevated in lakes because of internal loading and longer residence times, whereas fluvial nitrogen was assumed to be diluted by continuous flow.
This assumption is increasingly questionable. China’s rivers receive massive nitrogen loads from domestic sewage, livestock manure and synthetic-fertilizer runoff, and recent studies suggest that riverine TN concentrations in many Chinese basins far exceed the lake-reservoir grade-III limit of 1.0 mg L⁻¹⁴⁻⁶. Hu et al.⁷ found that in the downstream Yangtze below the Gezhouba Dam, TN consistently exceeded the grade-III standard while TP met it. If TN were included in river assessment, the reported excellent water-quality rates could be substantially revised, with profound implications for how pollution is prioritised and controlled. However, no systematic, high-frequency, multi-river analysis has quantified the magnitude of this assessment gap or characterised the sources and transport regimes that drive it.
The Yangtze basin supplies water to more than 40% of China’s population and is the focus of the country’s largest river-protection campaign⁸. Its three major upper–middle tributaries—the Min, Jialing and Han rivers—drain contrasting landscapes: the Min River flows through the densely populated Sichuan Basin, the Jialing River traverses mountainous terrain with mixed agriculture, and the Han River is the water source for the Middle Route of the South-to-North Water Diversion Project⁹. The Jialing River alone accounts for approximately 35% of the total nitrogen transported to the upper Yangtze and ultimately the Three Gorges Reservoir¹⁰. These differences make the three rivers an ideal natural laboratory for testing whether nutrient sources and transport regimes vary systematically within a single basin.
Here we use 4 years of hourly automatic-monitoring data (2021–2025) from 37 national control sections across the three rivers to address three questions: (1) How does excluding TN from river assessment alter the reported water-quality status? (2) Do nitrogen and phosphorus exhibit distinct seasonal signatures that indicate different dominant sources? (3) Do nutrient–sediment coupling relationships differ across rivers, implying divergent transport regimes? Our findings reveal that the current assessment framework systematically masks pervasive nitrogen pollution, and that neighbouring rivers within the same basin operate under fundamentally different nutrient source and transport regimes.
Study area
The study focuses on three major tributaries of the upper–middle Yangtze River (Fig. 1a): the Min River (6 national control sections), the Jialing River (13 sections) and the Han River (18 sections), totalling 37 sections. All three rivers ultimately drain into the Yangtze main stem. Sections are ordered longitudinally from upstream to downstream based on administrative regions (Fig. 1b). Note that station coordinates in the public database are approximate and contain geocoding errors; we therefore present section locations by longitudinal ordering rather than true map coordinates.
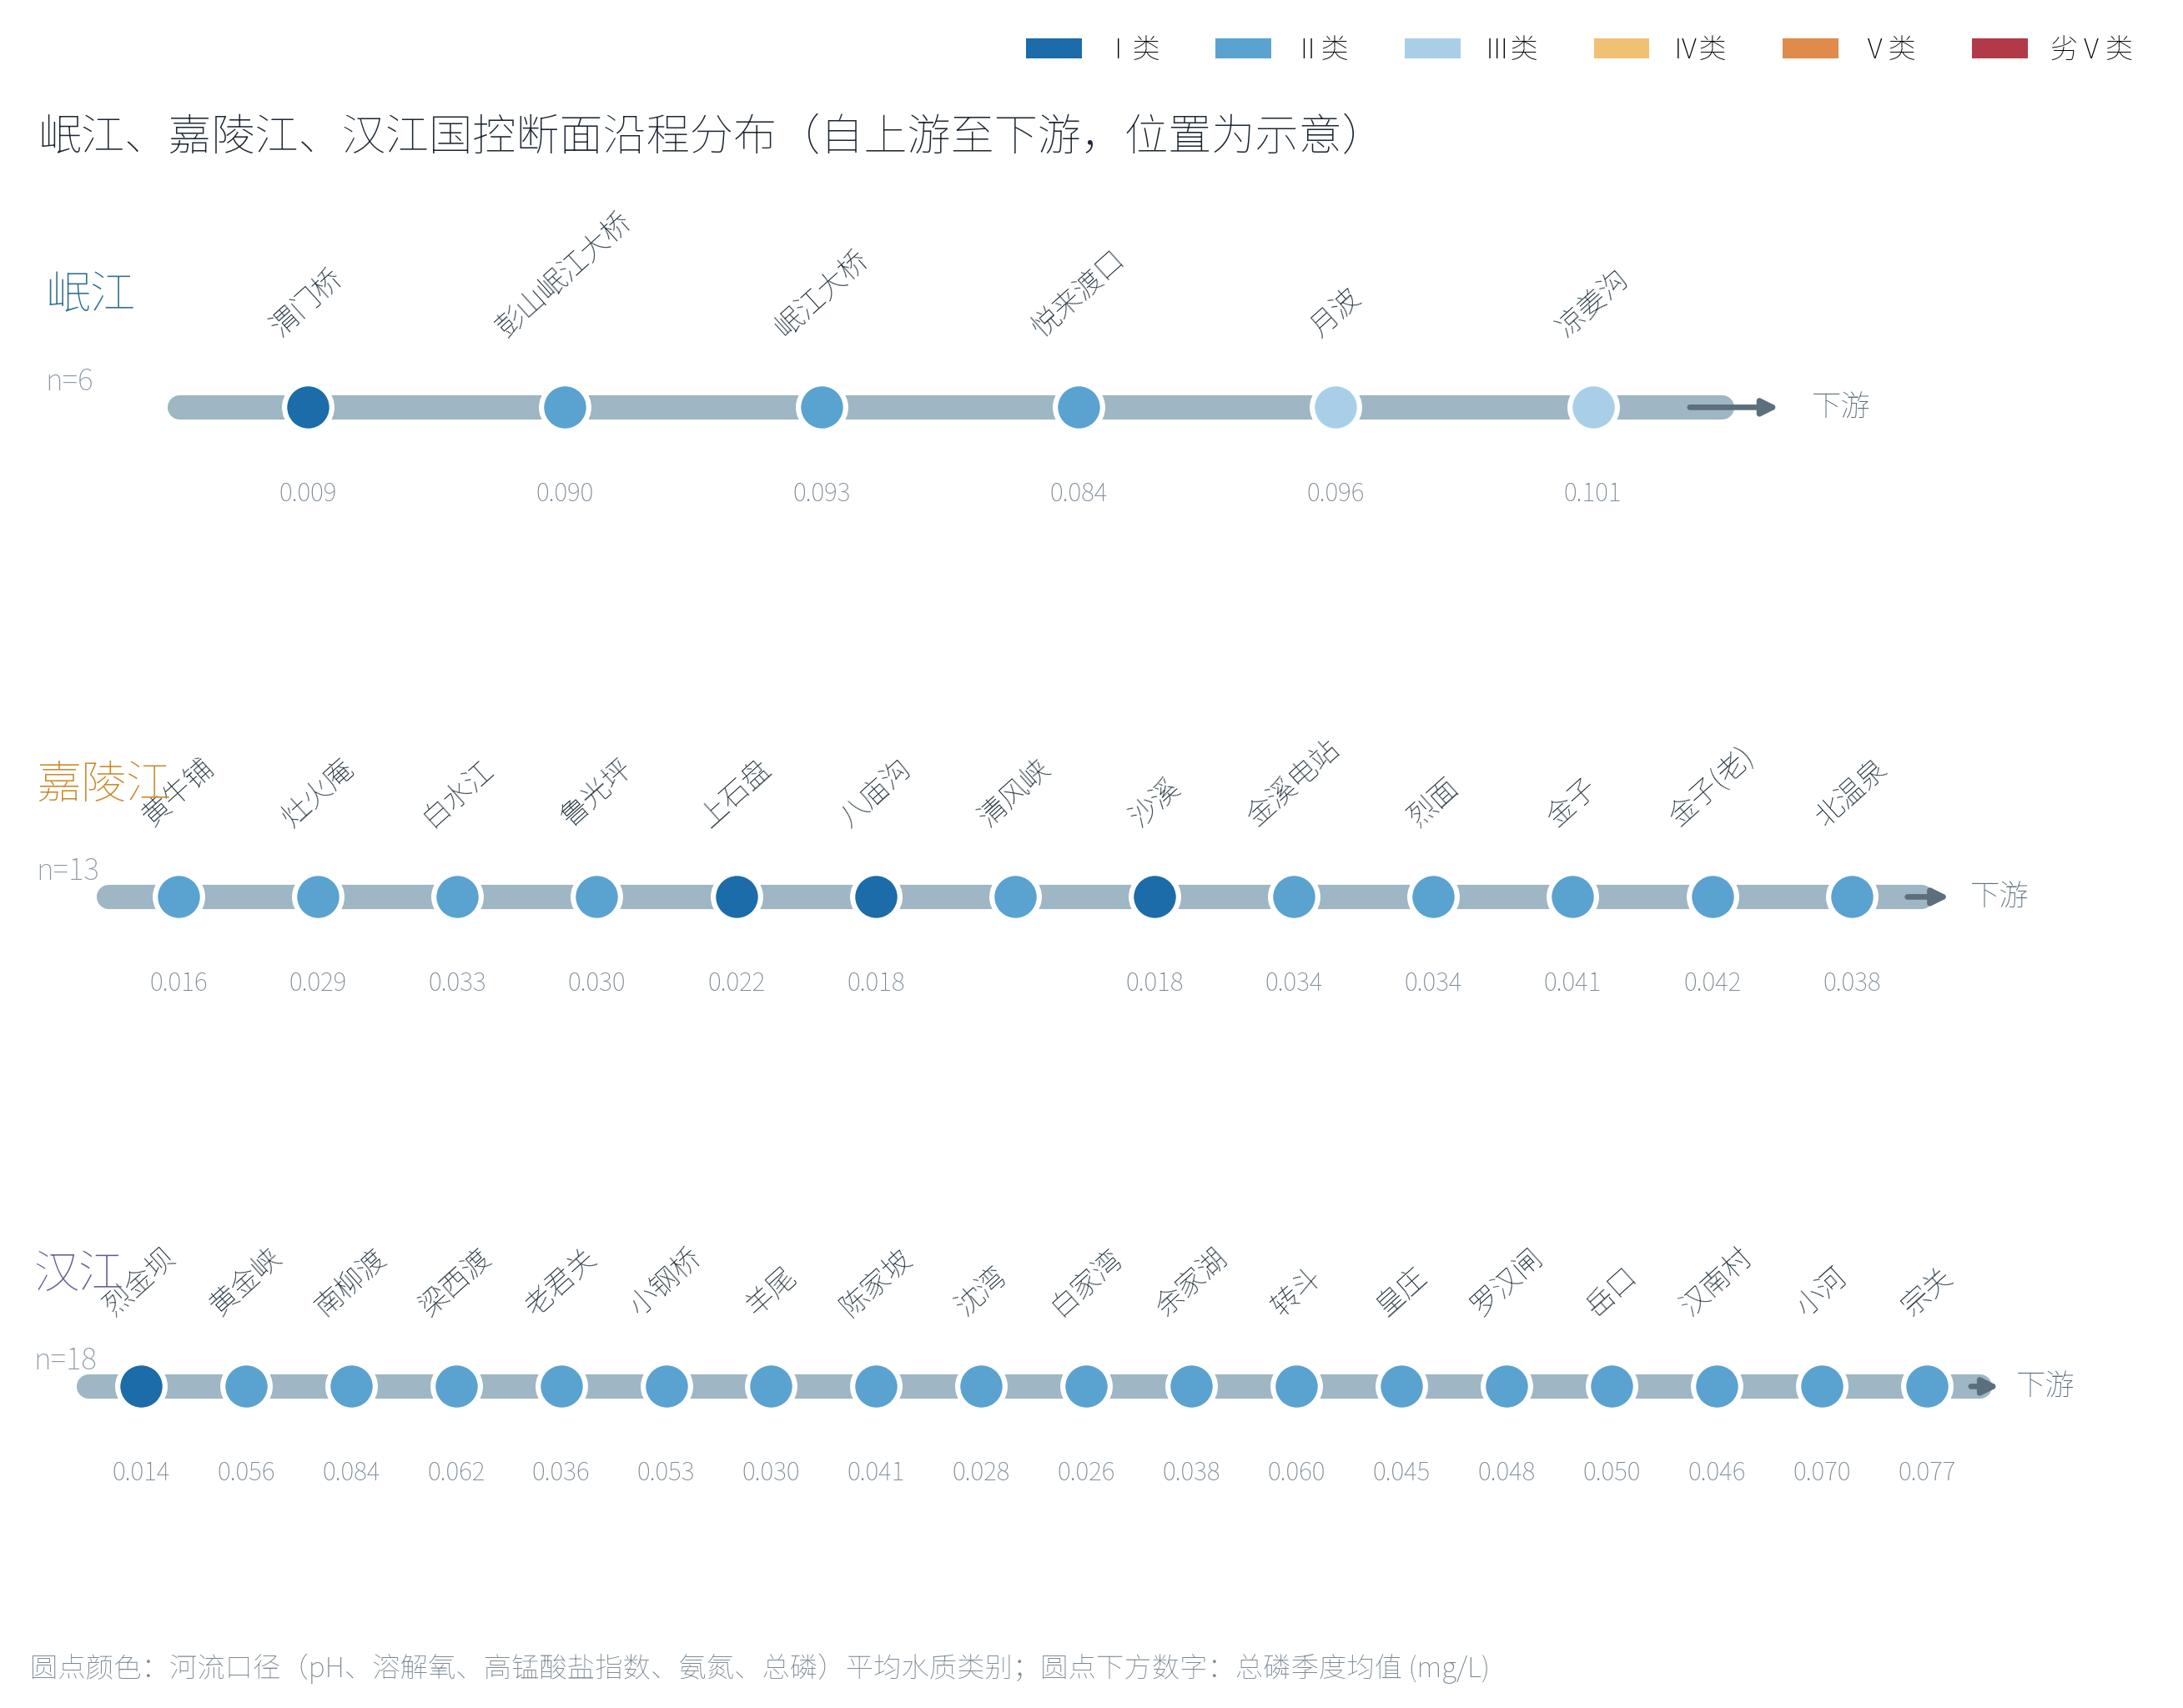
Fig. 1 | Study area and section distribution. a, Schematic of the three Yangtze tributaries. b, Longitudinal ordering of the 37 national control sections from upstream (left) to downstream (right). Dot colour indicates the mean water-quality category (river five-indicator standard); numbers below dots indicate mean total phosphorus (mg L⁻¹).
Results
1. Water-quality status and the total-nitrogen assessment gap
Under the official river five-indicator standard (pH, dissolved oxygen (DO), permanganate index (CODₘₙ), ammonia nitrogen (NH₃-N) and total phosphorus (TP); GB3838-2002 Table 1, excluding TN), the pooled good-quality rate (grades I–III) across all three rivers was 99.1% over the 16 quarters with data (2021Q2–2025Q1). Grade II dominated (70.3%), followed by grade I (19.7%) and grade III (9.0%); only 0.7% of station-quarter observations fell into grade IV and 0.2% into grade V, with zero inferior-grade-V events (Fig. 2a). Inter-river differences were small: the Min, Jialing and Han rivers recorded good-quality rates of 100%, 98.9% and 99.0%, respectively.
Including TN—using the lake-reservoir limits from the same standard—transformed the picture dramatically. The pooled good-quality rate collapsed to 8.3%, and the dominant pollutant in every one of 48 river-quarters was TN (Fig. 2b). Among the 545 station-quarter observations, 91% exceeded the grade-III TN limit of 1.0 mg L⁻¹. The Han River was most affected (good-quality rate 2.2%), followed by the Jialing (14.8%) and Min (13.8%) rivers. This 90-percentage-point swing—from 99.1% to 8.3%—is not an artefact of calculation but a direct consequence of the standard’s design: TN limits were calibrated for lentic systems and are inapplicable to lotic systems, yet no river-specific TN limits have been established.
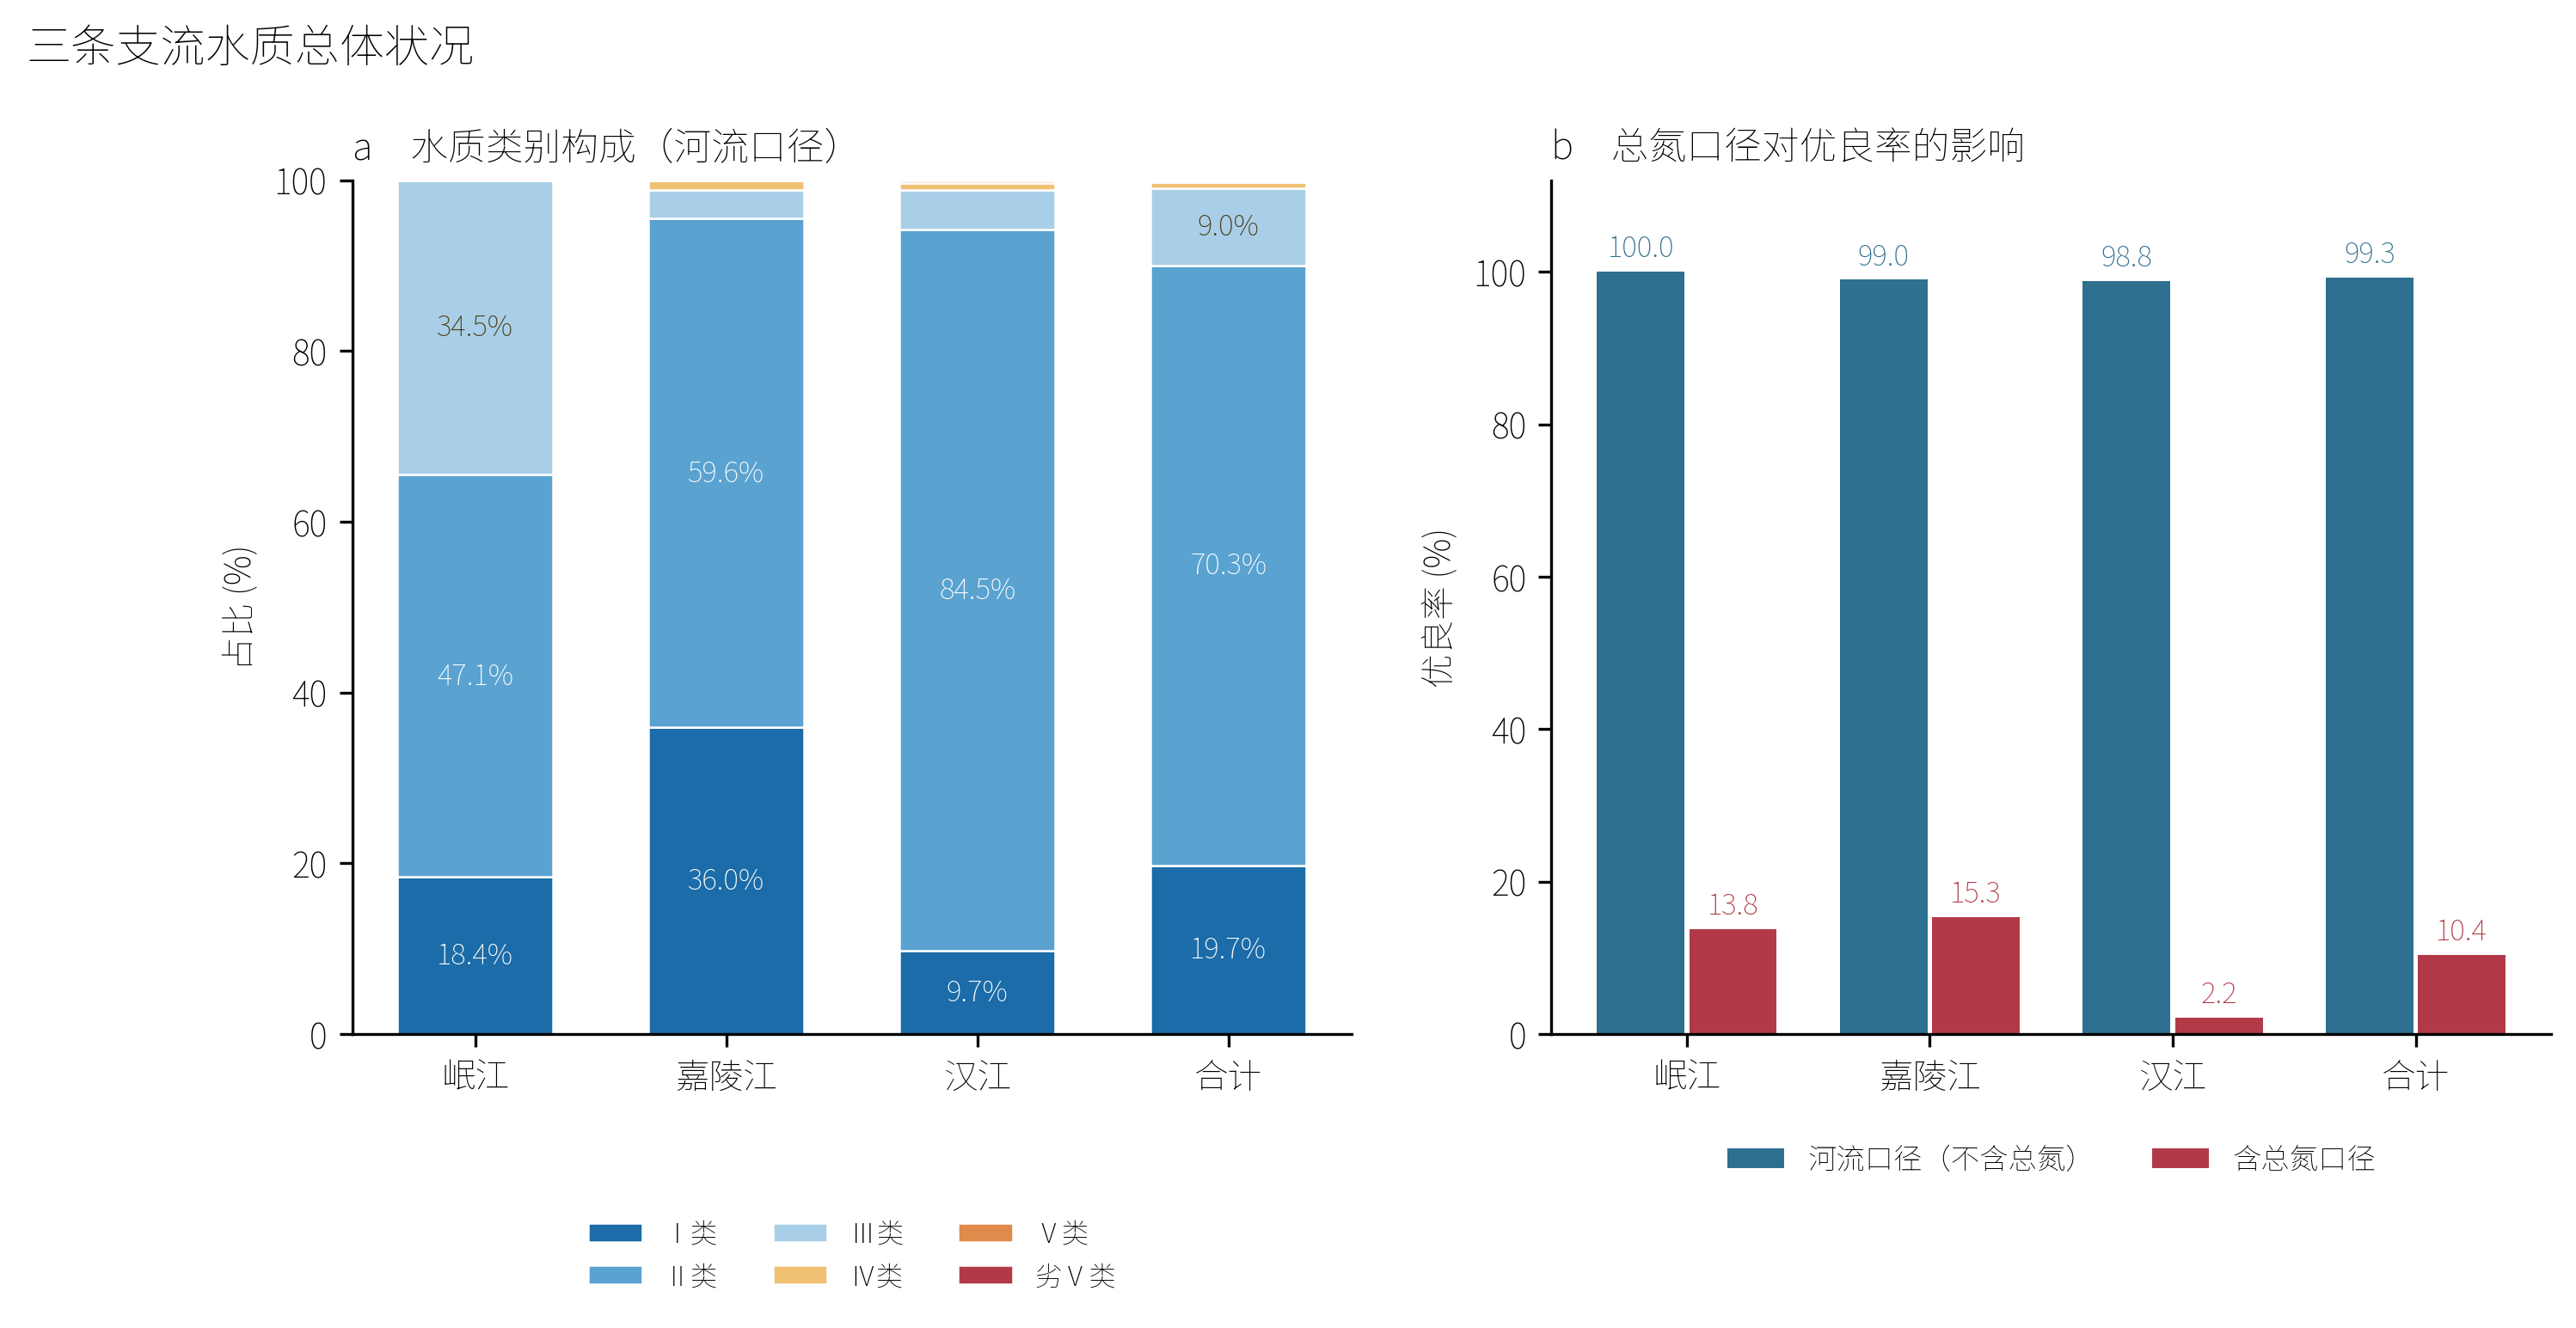
Fig. 2 | Water-quality category composition and the total-nitrogen assessment gap. a, Composition of water-quality categories (I to inferior V) for the Min, Jialing and Han rivers under the river five-indicator standard. b, Good-quality rate (grades I–III) under the five-indicator standard (blue) and the TN-inclusive six-indicator standard (red). Including TN reduces the pooled good-quality rate from 99.1% to 8.3%.
The spatiotemporal heatmap (Fig. 3) further reveals that under the five-indicator standard, only a handful of section-quarters in 2021 exceeded grade III; under the TN-inclusive standard, nearly all section-quarters across all three rivers are grade V or inferior V, with TN concentrations consistently above 1.0 mg L⁻¹.
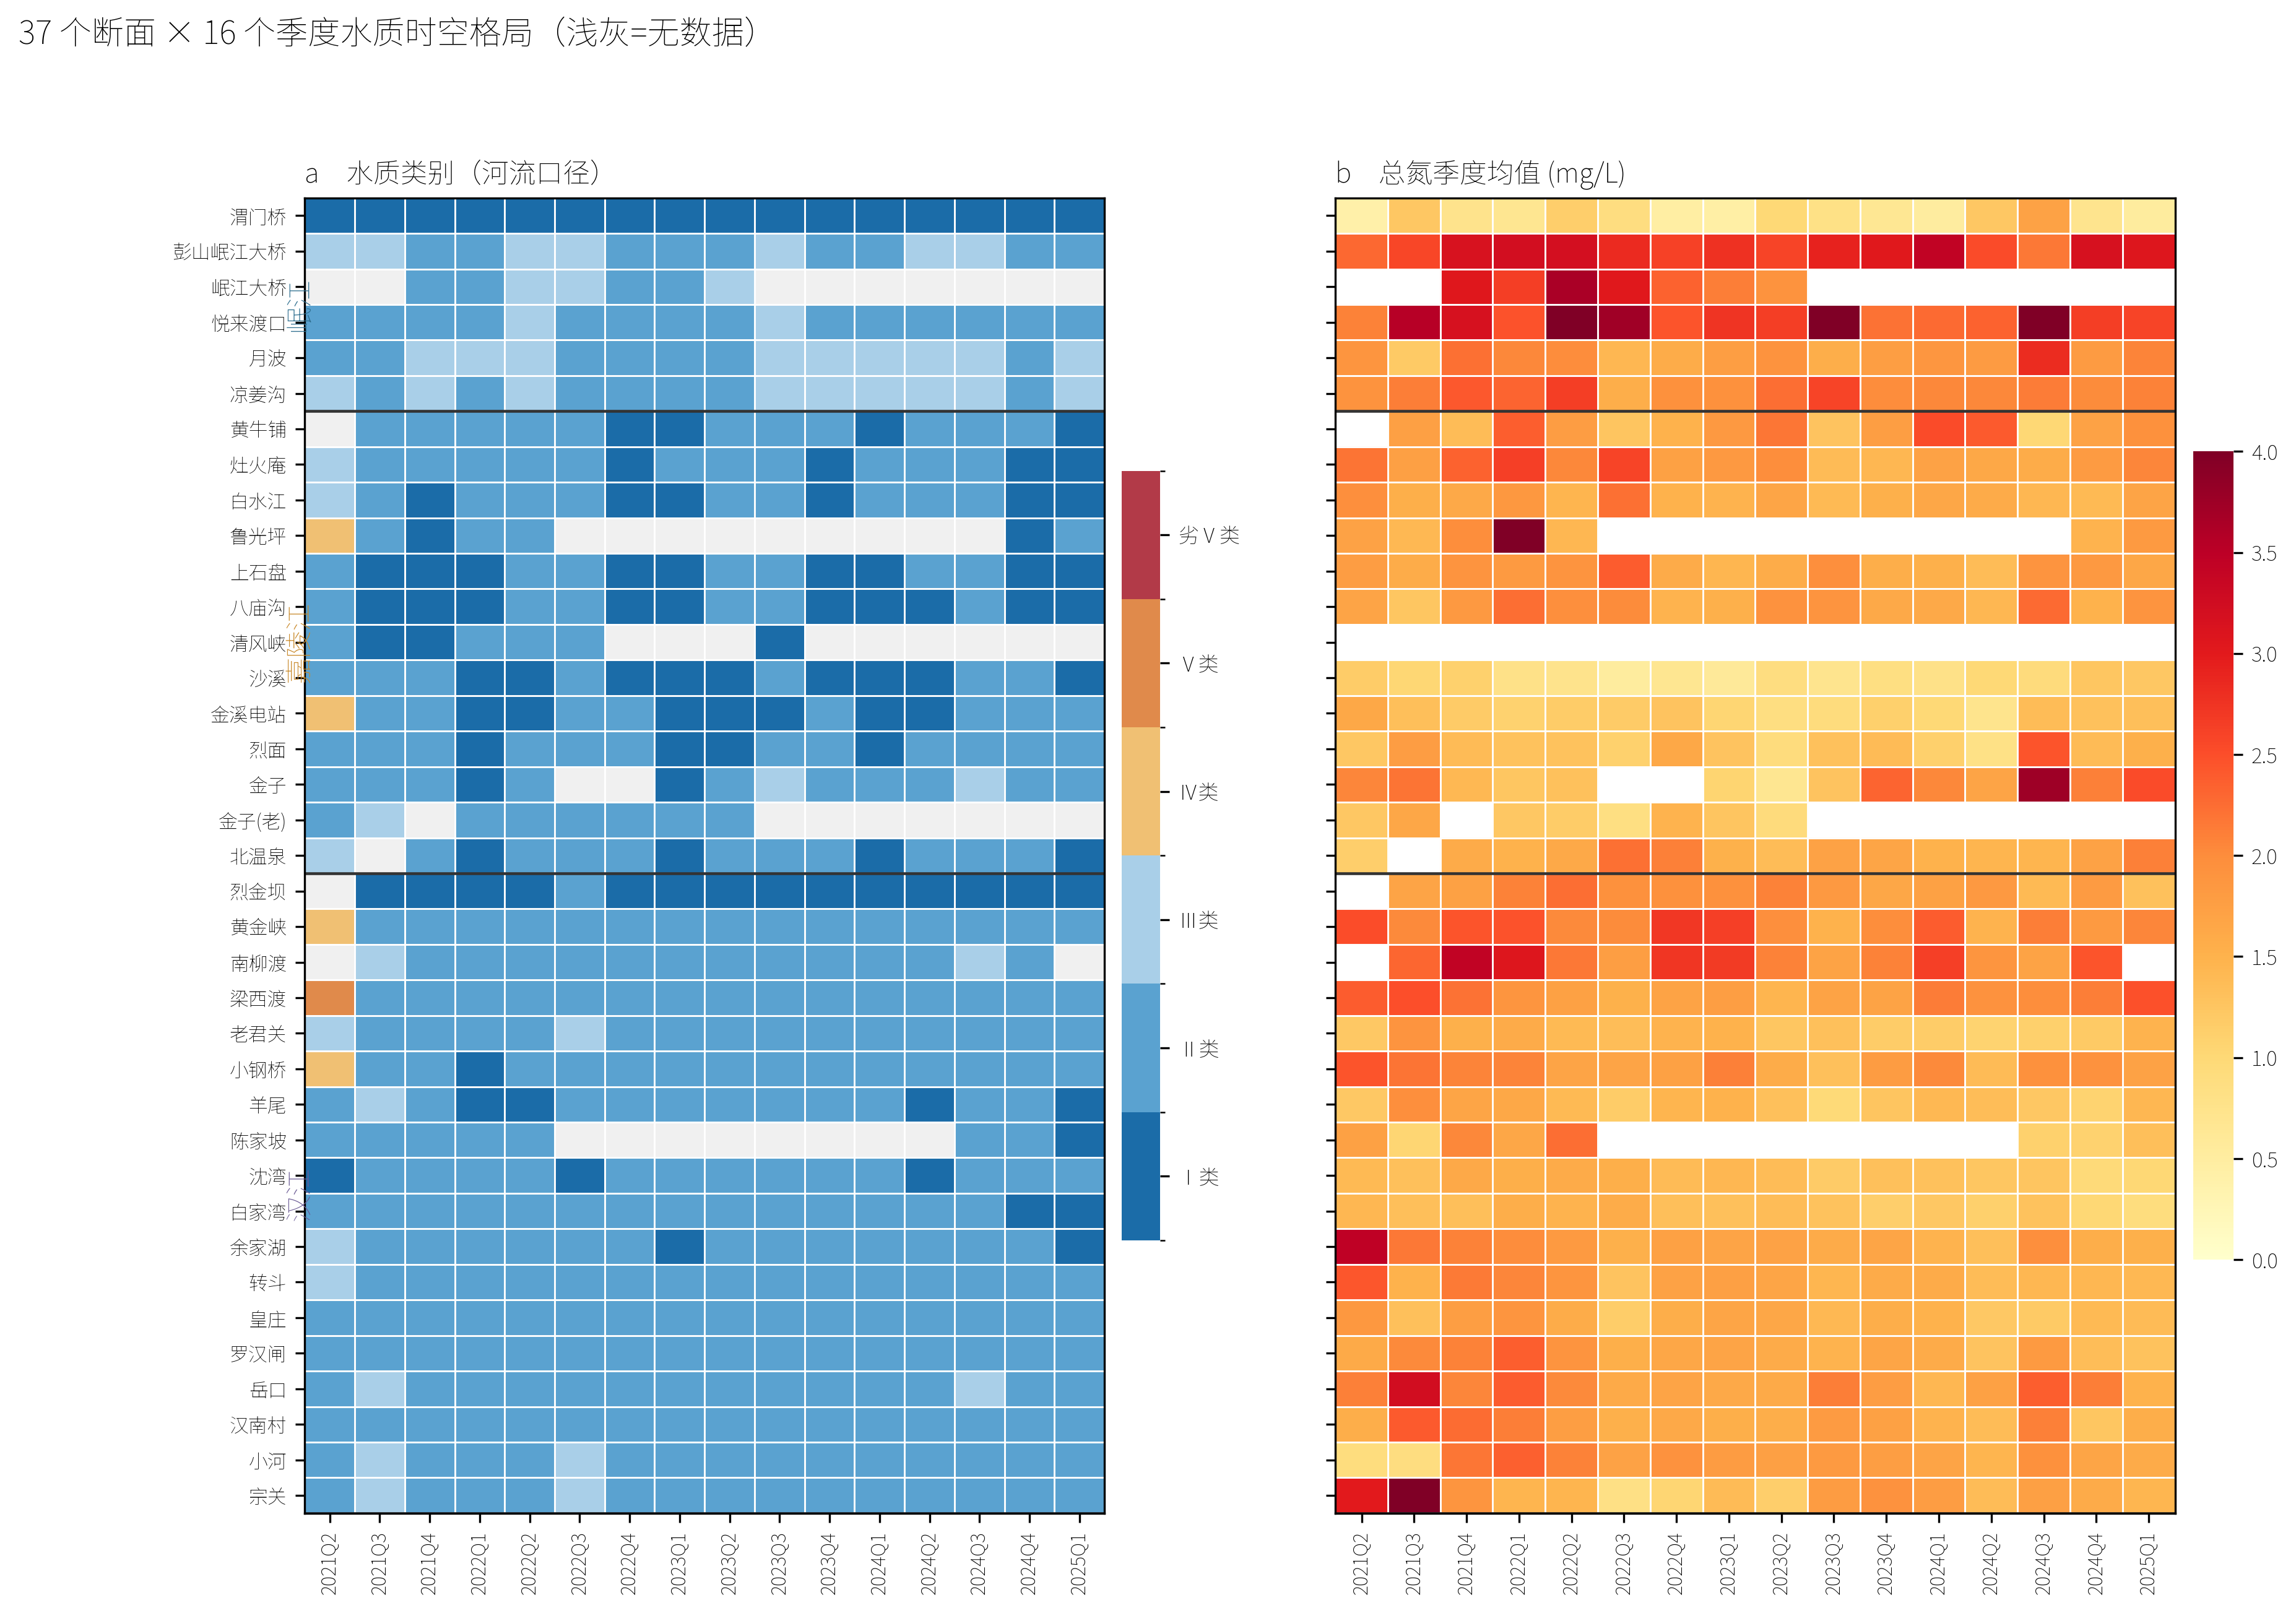
Fig. 3 | Spatiotemporal water-quality matrix for 37 sections × 16 quarters. Left panel: water-quality category under the river five-indicator standard (light grey = no data). Right panel: total nitrogen concentration gradient. Nearly all section-quarters exceed the grade-III TN limit of 1.0 mg L⁻¹.
To confirm that the five-indicator river assessment matches official practice, we compared our independently calculated categories with the “water-quality category” field supplied by the monitoring platform. The agreement was 98.87% for the five-indicator standard, but only 2.74% for the TN-inclusive standard (Fig. S2). This validates our method and confirms that the official river assessment indeed excludes TN.
Table 1 | Water-quality category composition by river (river five-indicator standard)
| River | I | II | III | IV | V | Inferior V |
|---|---|---|---|---|---|---|
| Min River | 18.4% | 47.1% | 34.5% | 0.0% | 0.0% | 0.0% |
| Jialing River | 36.0% | 59.6% | 3.4% | 1.1% | 0.0% | 0.0% |
| Han River | 9.7% | 84.5% | 4.7% | 0.7% | 0.4% | 0.0% |
| Total | 19.7% | 70.3% | 9.0% | 0.7% | 0.2% | 0.0% |
Percentages are proportions of all station-quarter observations within each river (545 total).
2. Seasonal decoupling of nitrogen and phosphorus
Seasonal analysis of the nine monitored indicators revealed two distinct behaviour groups (Fig. 4). Turbidity, TP and CODₘₙ all exhibited pronounced flood-season (Q2–Q3) elevation: turbidity increased by 121% between the dry and wet seasons, TP by approximately 60%, and CODₘₙ by roughly 35%. DO declined in parallel, consistent with reduced oxygen solubility at higher water temperatures (DO–water temperature ρ = −0.83). By contrast, TN remained nearly constant across all four quarters, fluctuating between 1.70 and 1.78 mg L⁻¹—a seasonal amplitude of only 5% (Fig. 5).
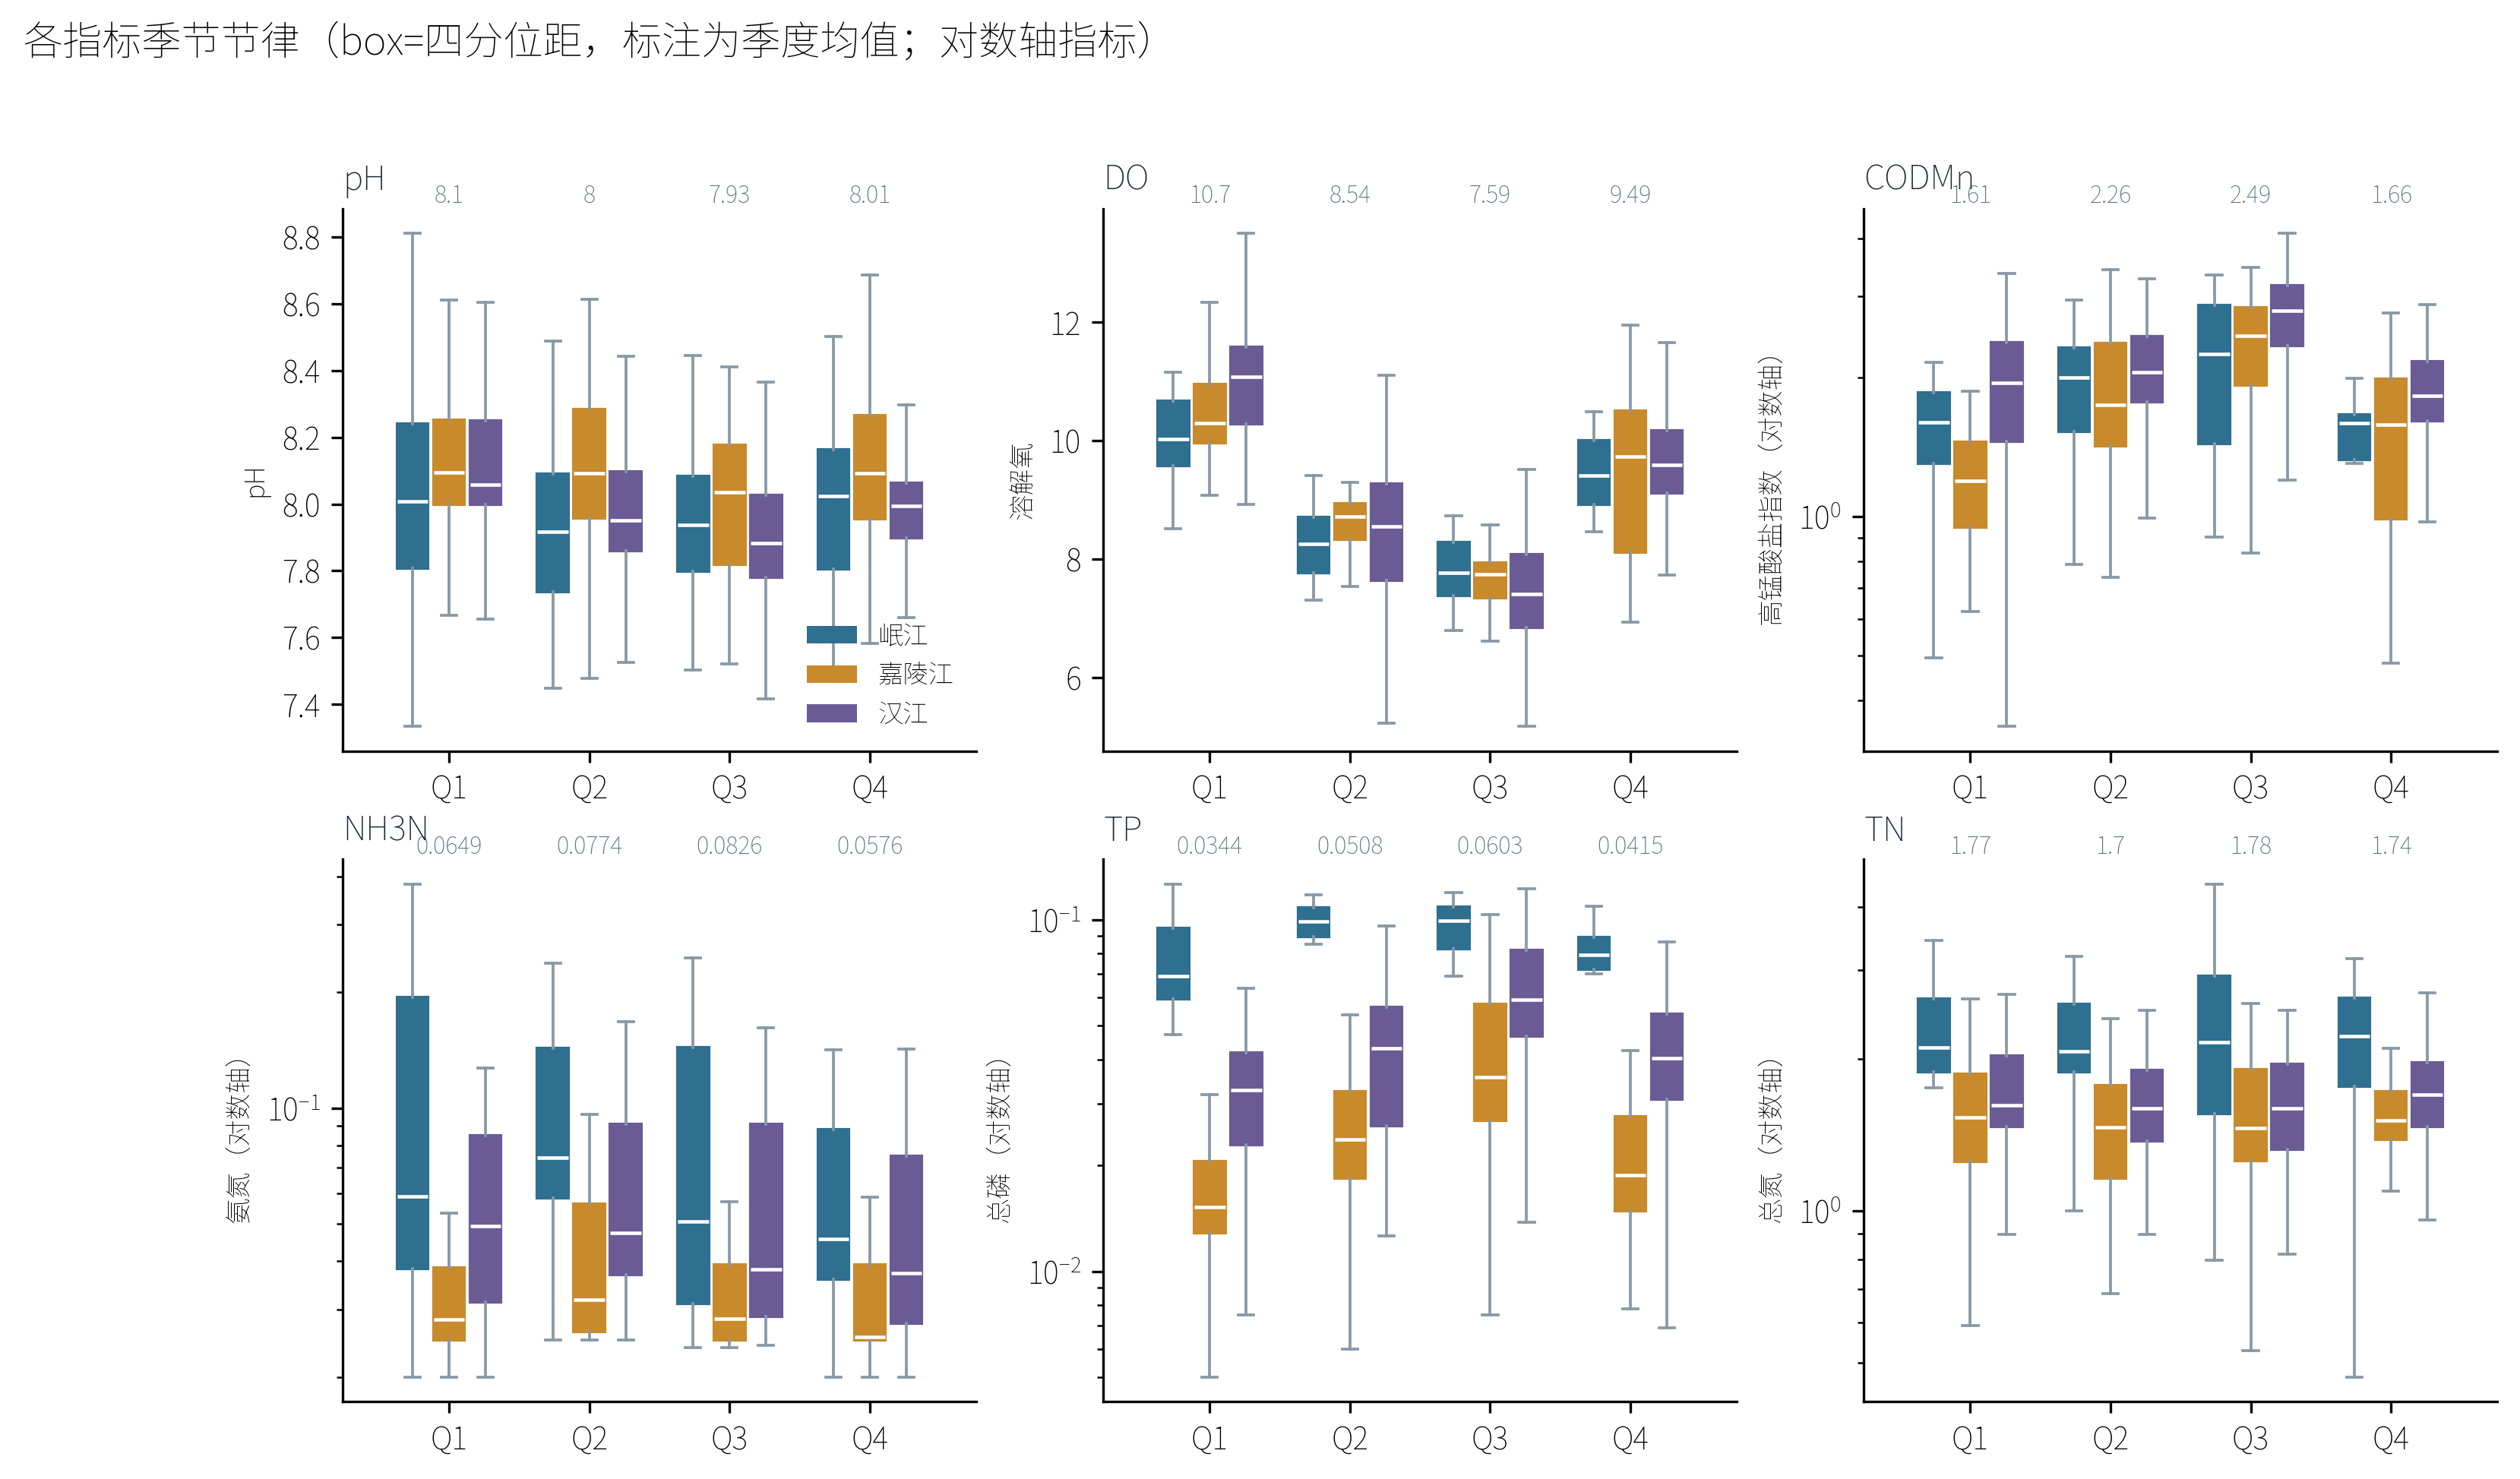
Fig. 4 | Seasonal rhythms of all monitored indicators. Box plots show the distribution of each indicator by quarter, grouped by river. Turbidity, TP and CODₘₙ rise sharply in the flood season (Q2–Q3), whereas DO declines. TN is nearly constant across all quarters.
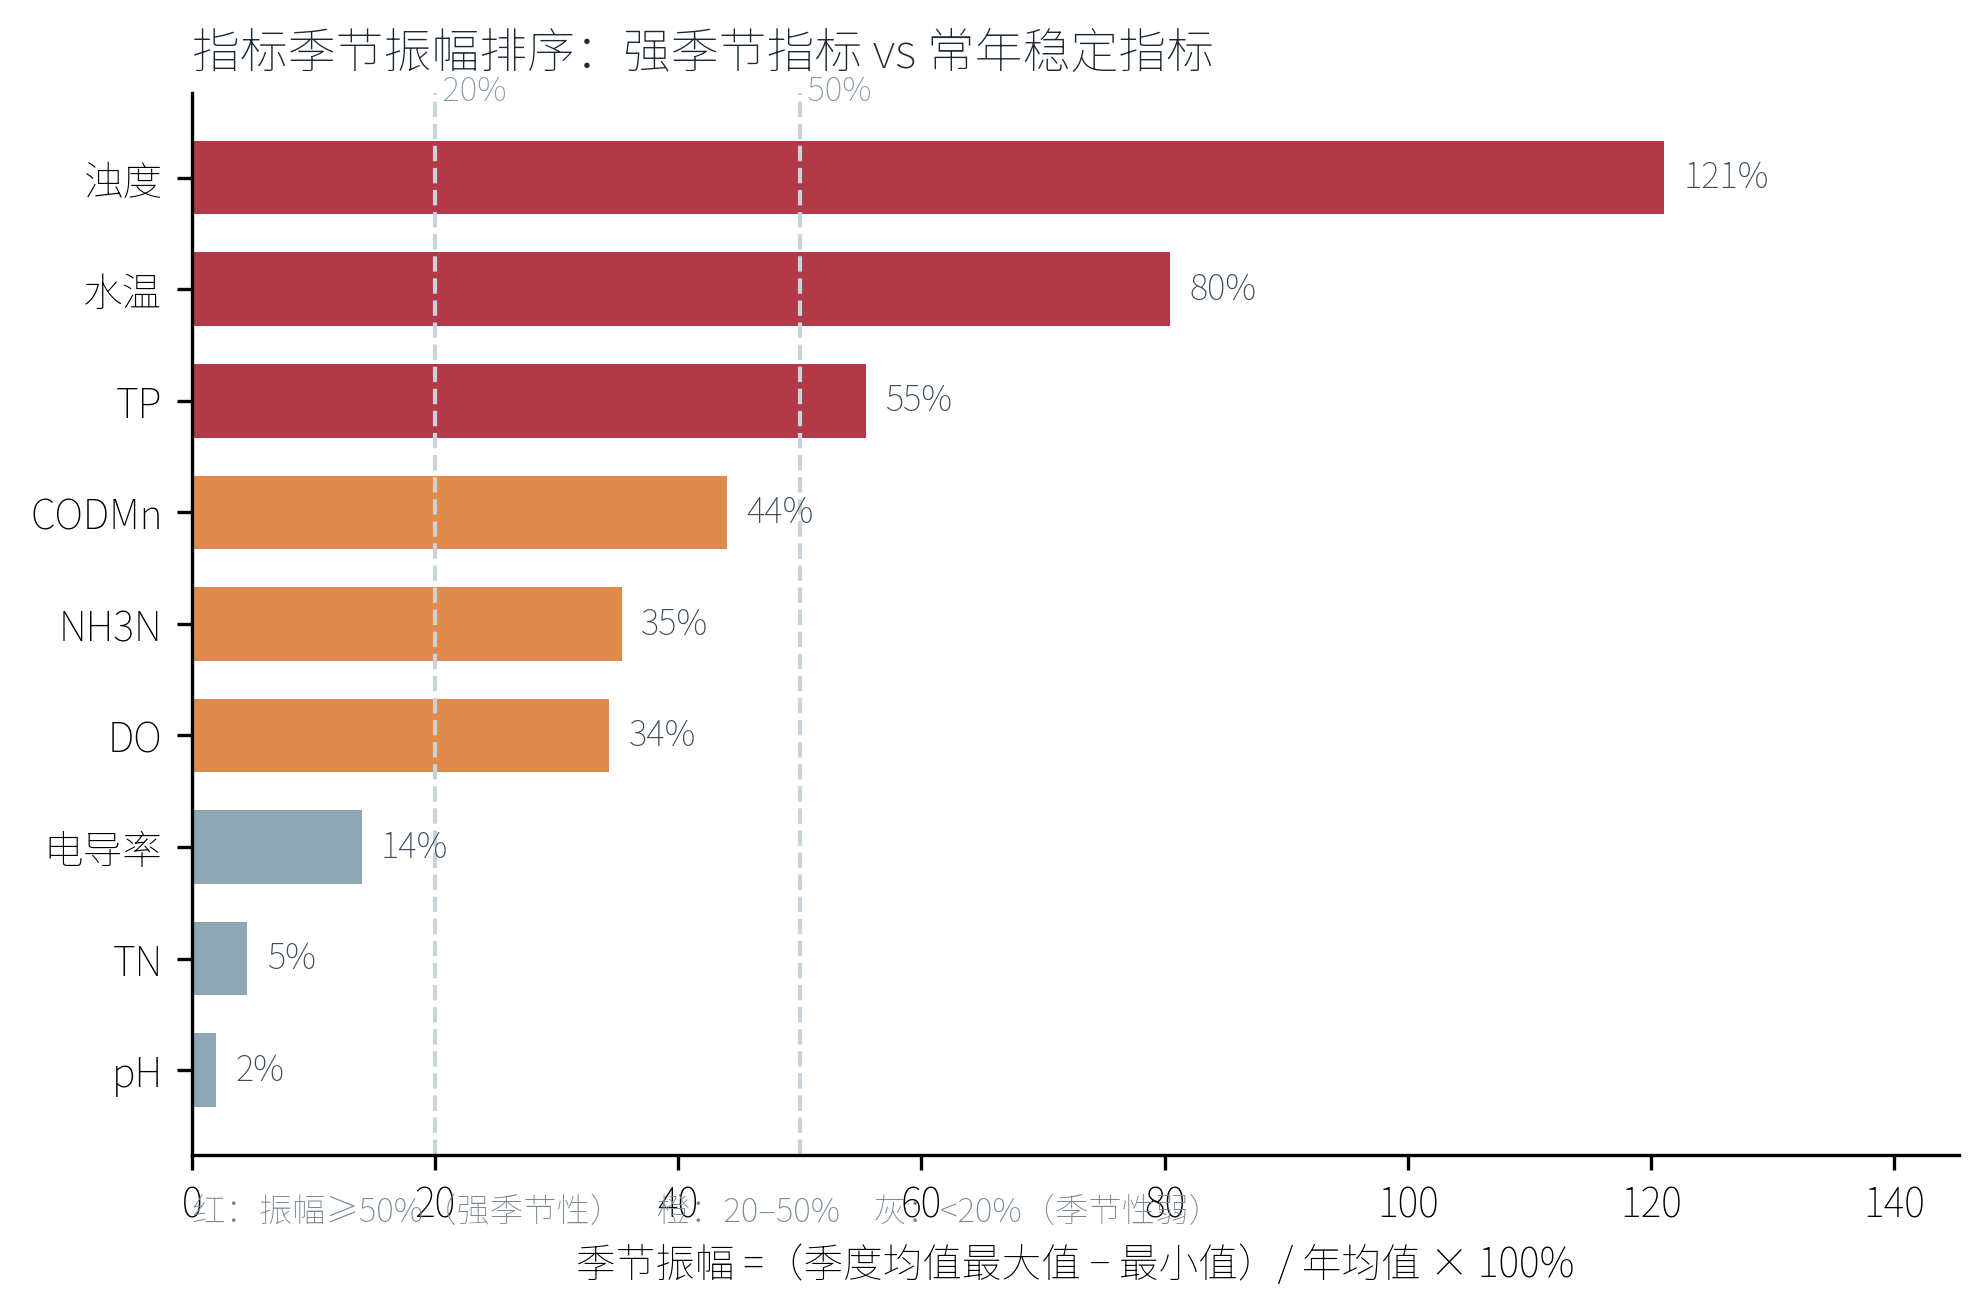
Fig. 5 | Seasonal amplitude ranking of indicators. Seasonal amplitude is calculated as (max − min) / median × 100% across the four quarterly medians. Turbidity has the strongest seasonality (121%), whereas TN has the weakest (5%), forming a clear contrast.
This seasonal decoupling is mechanistically informative. The strong seasonality of TP, turbidity and CODₘₙ is characteristic of sediment-driven non-point-source pollution: rainfall-runoff events erode soil and transport particle-bound phosphorus and organic matter into rivers during the wet season. The absence of seasonality in TN indicates that nitrogen inputs are dominated by continuous point sources—most likely municipal and industrial wastewater discharges and groundwater baseflow enriched by agricultural nitrogen leaching—which do not co-vary with runoff.
| NH₃-N showed intermediate seasonality (amplitude ~20%), consistent with a mix of point-source effluent and biological nitrification–denitrification processes that are temperature-dependent. The correlation structure reinforced this interpretation: CODₘₙ–TP (ρ = 0.63) and NH₃-N–TP (ρ = 0.53) were positively correlated, suggesting shared organic-matter and nutrient sources, whereas conductivity was weakly correlated with all other indicators ( | ρ | < 0.2), reflecting geological background rather than anthropogenic input (Fig. 6). |
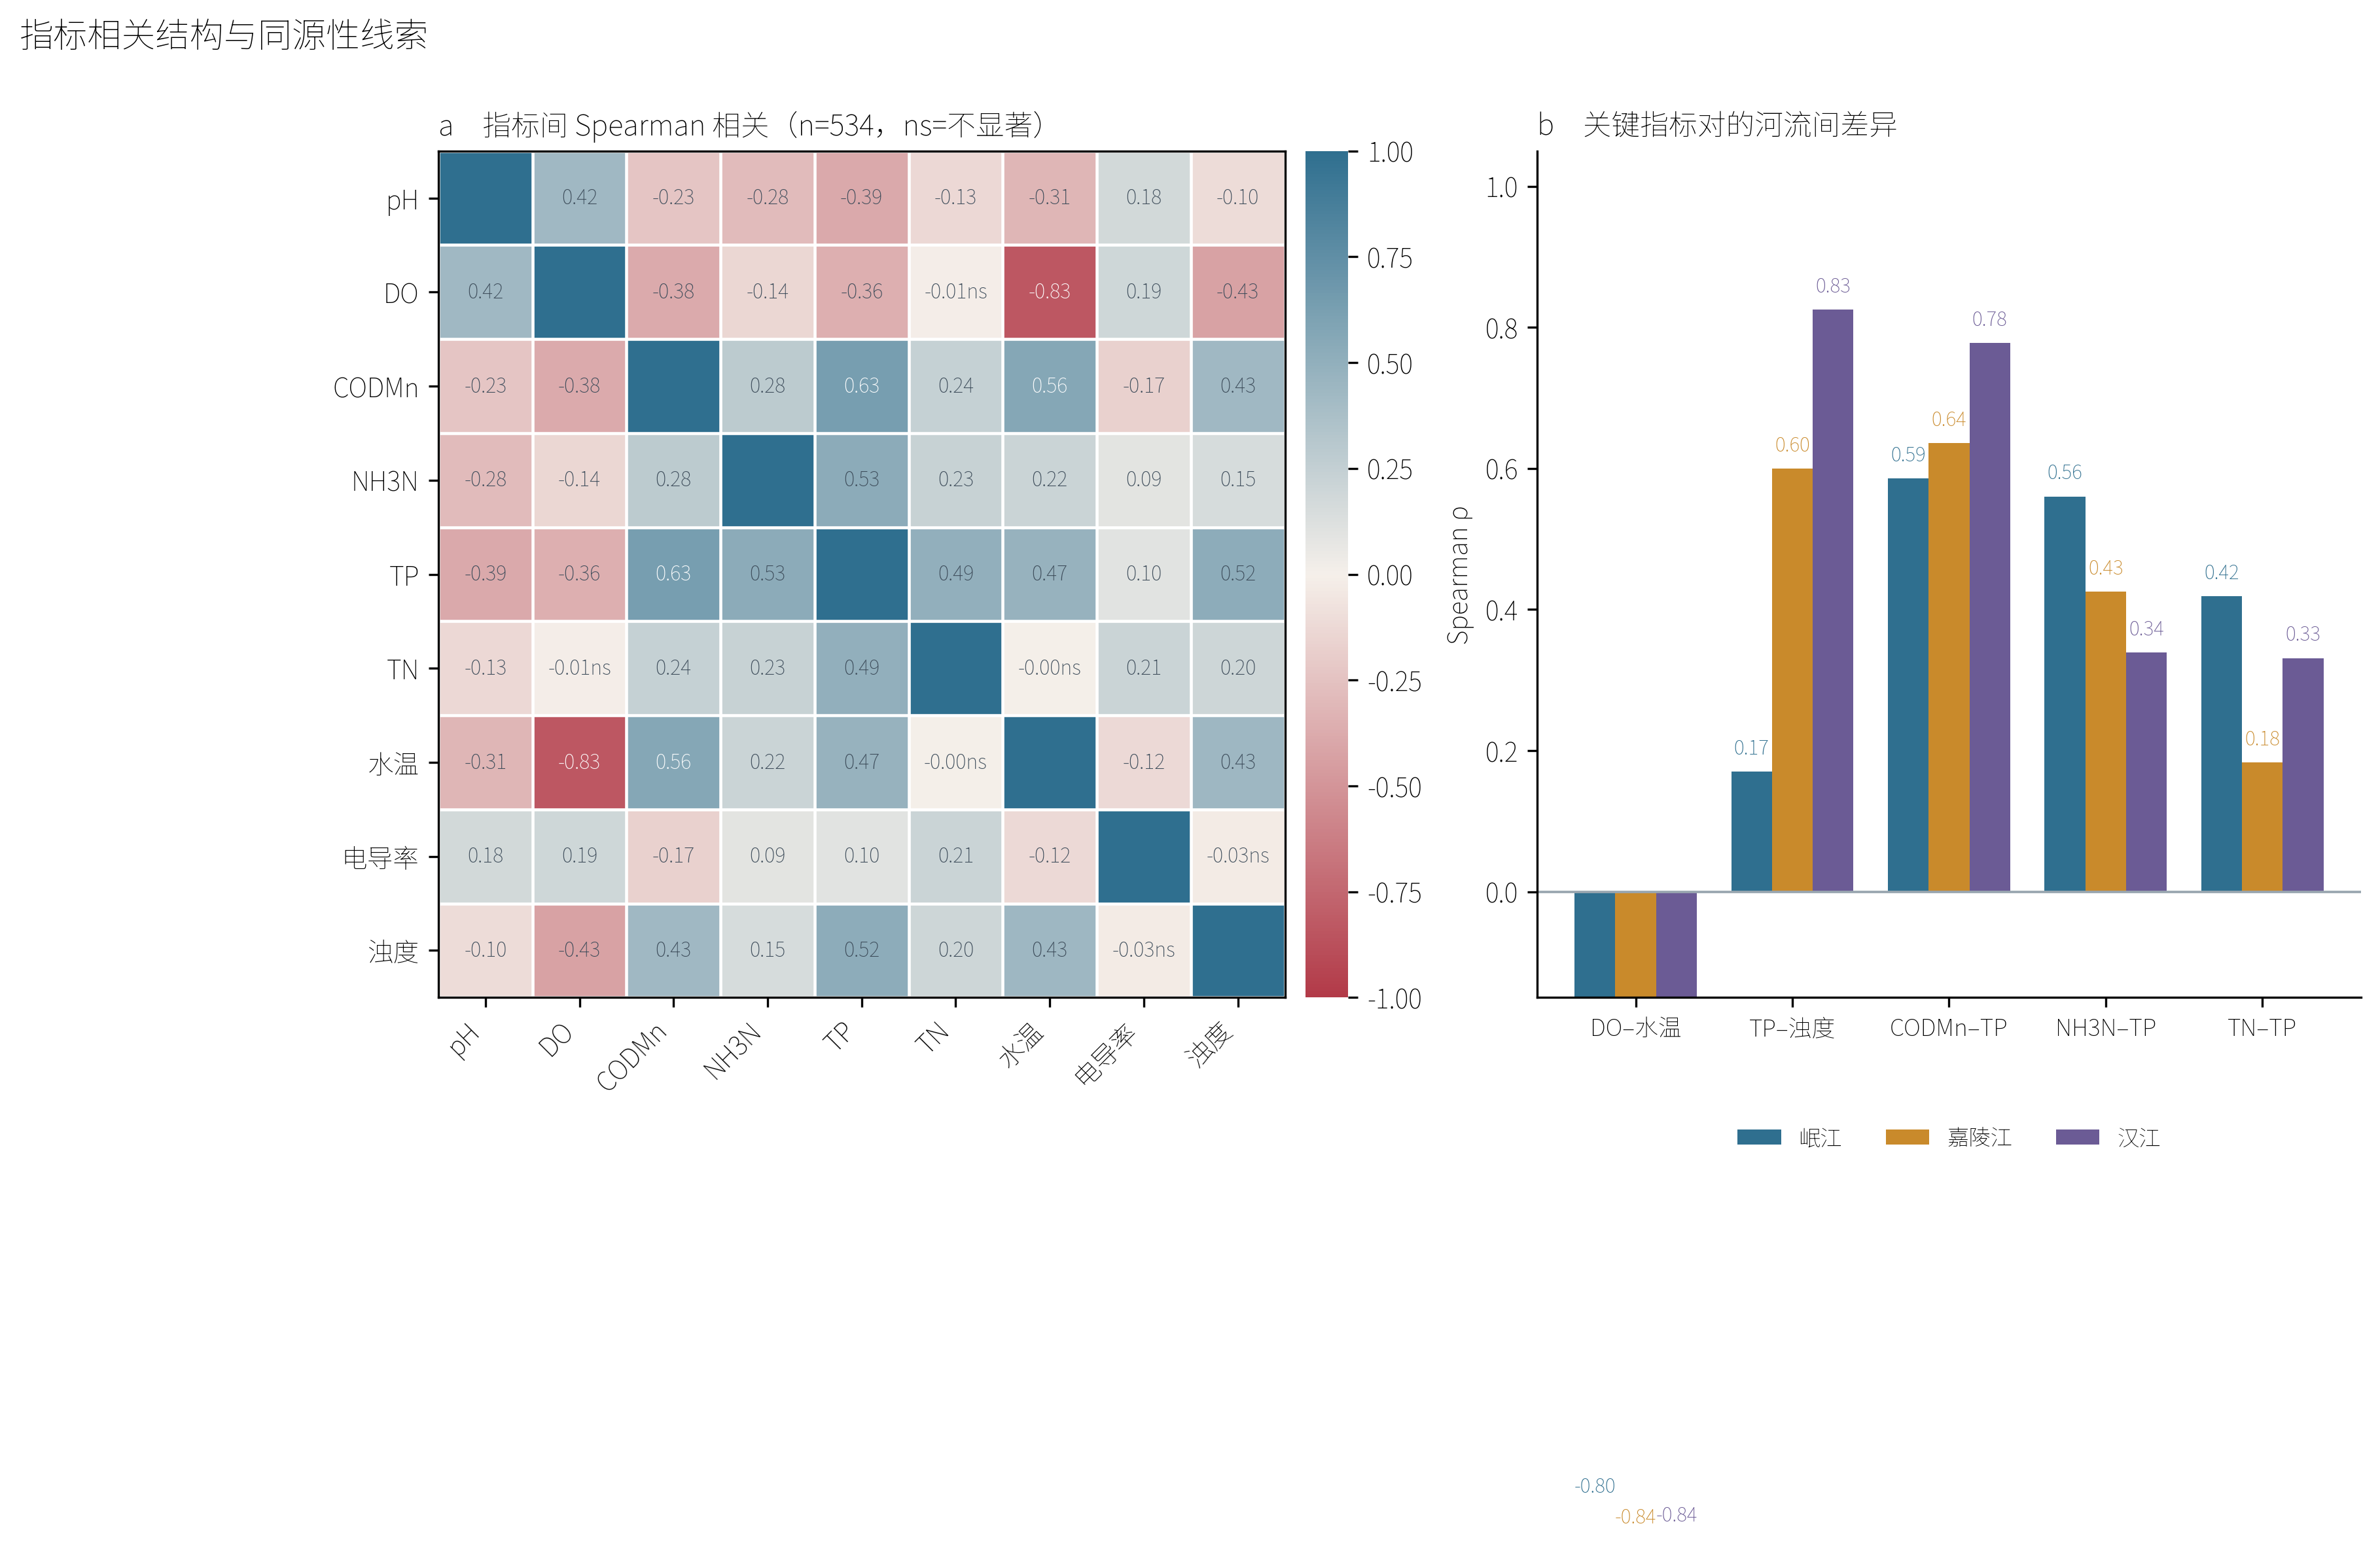
Fig. 6 | Indicator correlation structure. a, Spearman correlation matrix of all nine indicators. DO–water temperature ρ = −0.83 (physical solubility control); CODₘₙ–TP ρ = 0.63 and NH₃-N–TP ρ = 0.53 (shared organic and nutrient sources); conductivity is weakly correlated with all other indicators (geological background). b, Key indicator pairs plotted by river, showing inter-river differences.
3. River-specific phosphorus transport regimes
The most striking finding was that the coupling between TP and turbidity—an indicator of whether phosphorus is transported primarily with suspended sediment—differed dramatically across the three rivers (Fig. 7). In the Han River, TP and turbidity were strongly coupled (ρ = 0.83), indicating that phosphorus is predominantly particle-bound and mobilised by sediment during runoff events. In the Jialing River, the coupling was moderate (ρ = 0.60). In the Min River, however, TP and turbidity were essentially decoupled (ρ = 0.17), meaning that phosphorus concentrations are independent of sediment load.
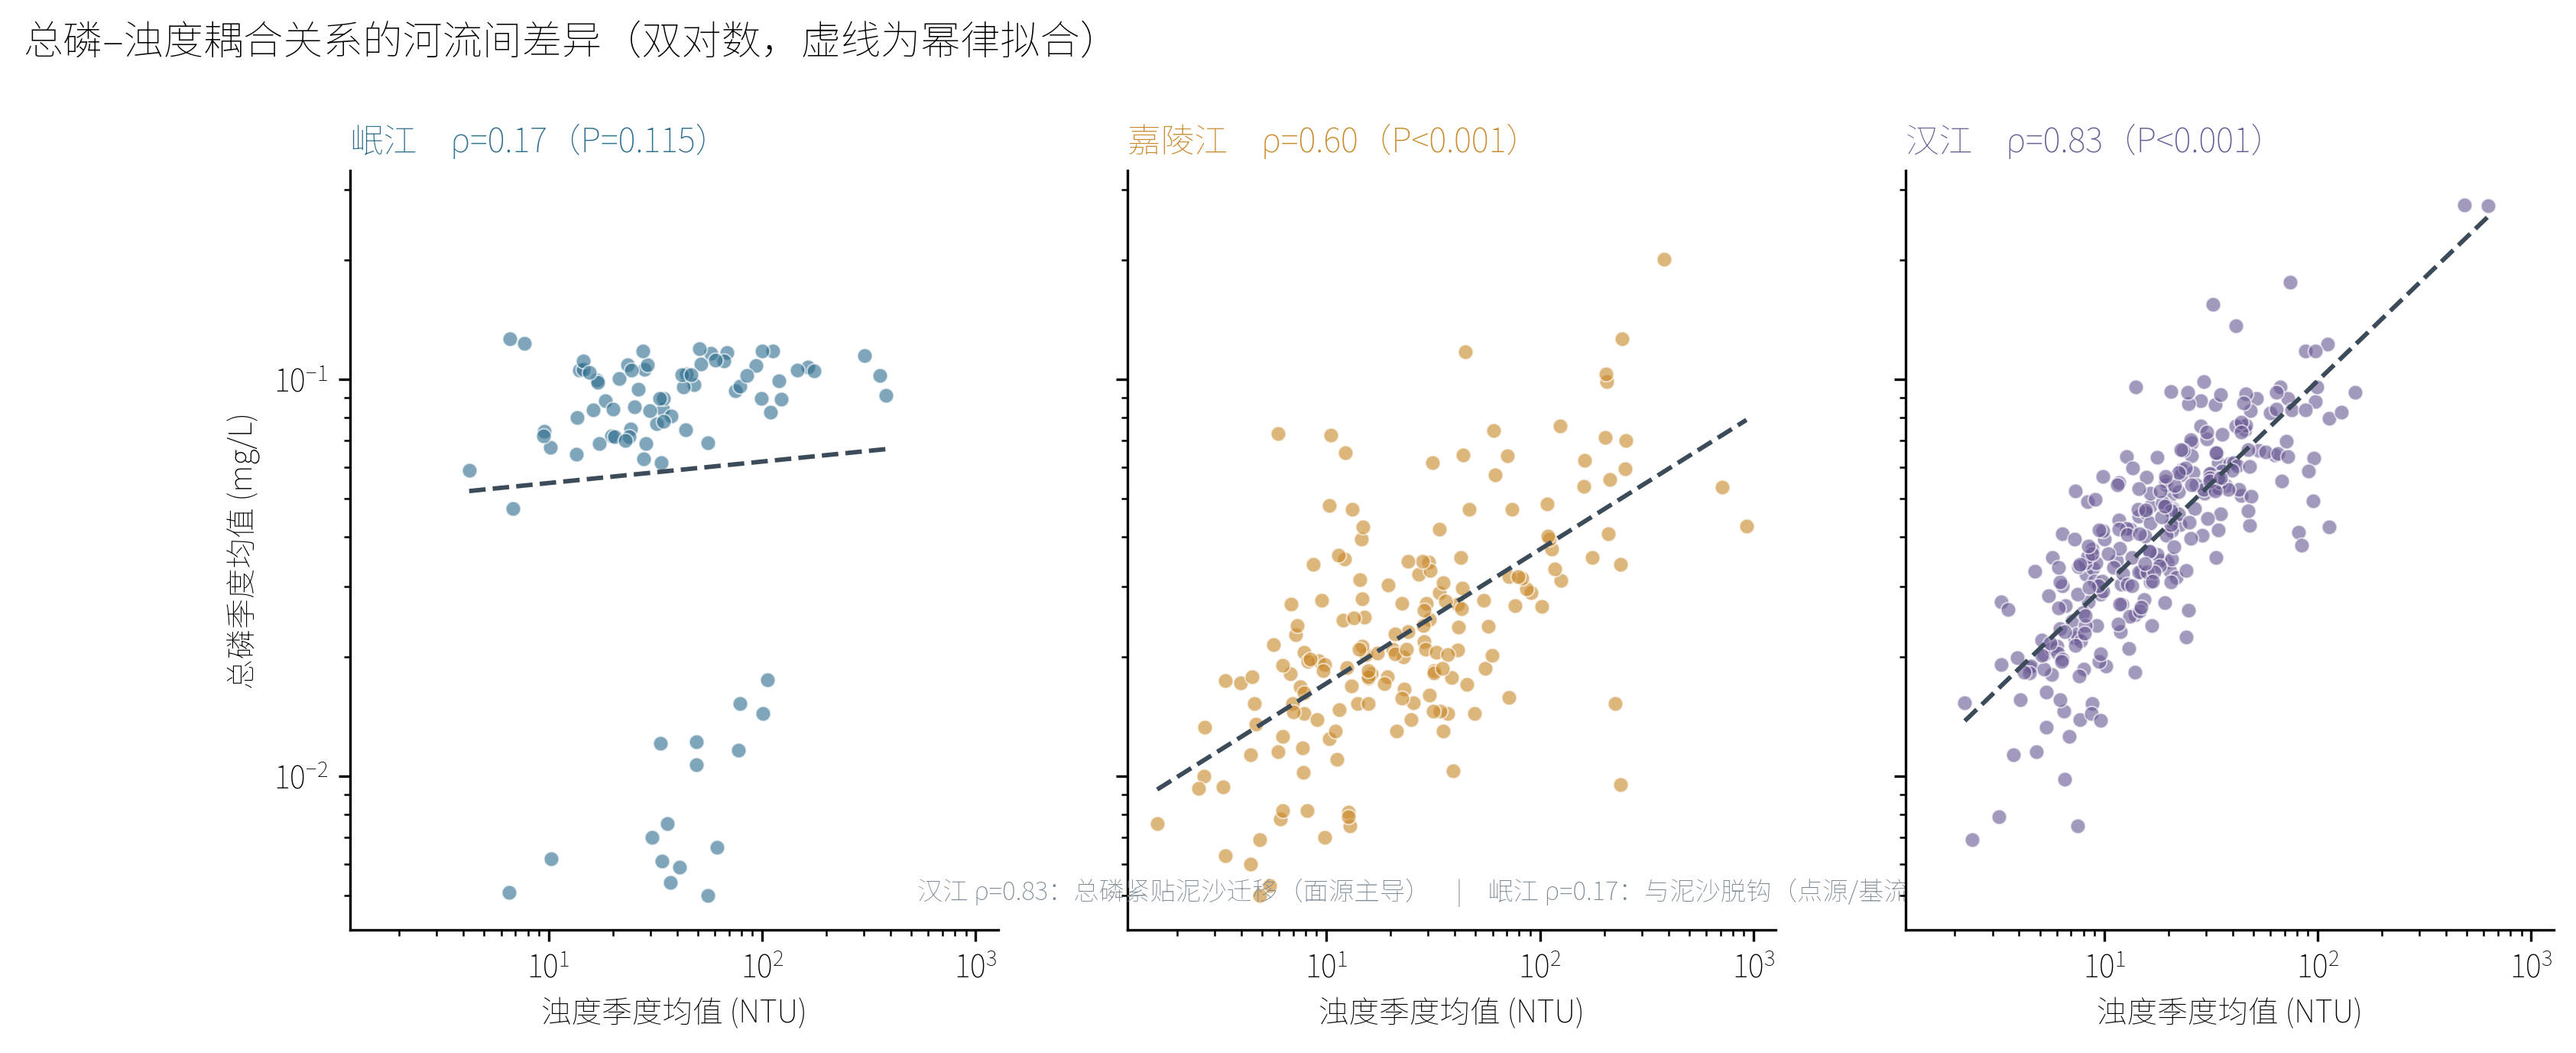
Fig. 7 | River-specific TP–turbidity coupling. Scatter plots of TP versus turbidity for each river. The Han River shows strong coupling (ρ = 0.83), the Jialing River moderate coupling (ρ = 0.60), and the Min River essentially no coupling (ρ = 0.17), indicating fundamentally different phosphorus transport regimes.
This gradient reflects fundamentally different dominant phosphorus sources and transport pathways. The Han River basin, characterised by intensive agriculture on the Jianghan Plain, is dominated by non-point-source phosphorus that is adsorbed onto soil particles and flushed during storms. The Min River, which flows through the highly urbanised Chengdu Plain, is dominated by point-source phosphorus from wastewater treatment plants and industrial discharges that enter the river dissolved and decoupled from sediment. The Jialing River, with mixed mountainous and agricultural landscapes, exhibits an intermediate regime.
Principal component analysis (PCA) on the nine standardised indicators yielded a first two-component cumulative explained variance of 53.0% (Fig. 8). PC1 was primarily loaded by turbidity, TP, CODₘₙ and DO (negatively), representing the sediment–organic-matter axis. PC2 was loaded by TN and conductivity, representing the dissolved-solute axis. The three rivers occupied partially overlapping but distinct regions of the PCA space, with the Han River skewed toward the sediment axis and the Min River toward the dissolved-solute axis, corroborating the river-specific transport regimes identified above (see Supplementary Table S3 for full PCA loadings).
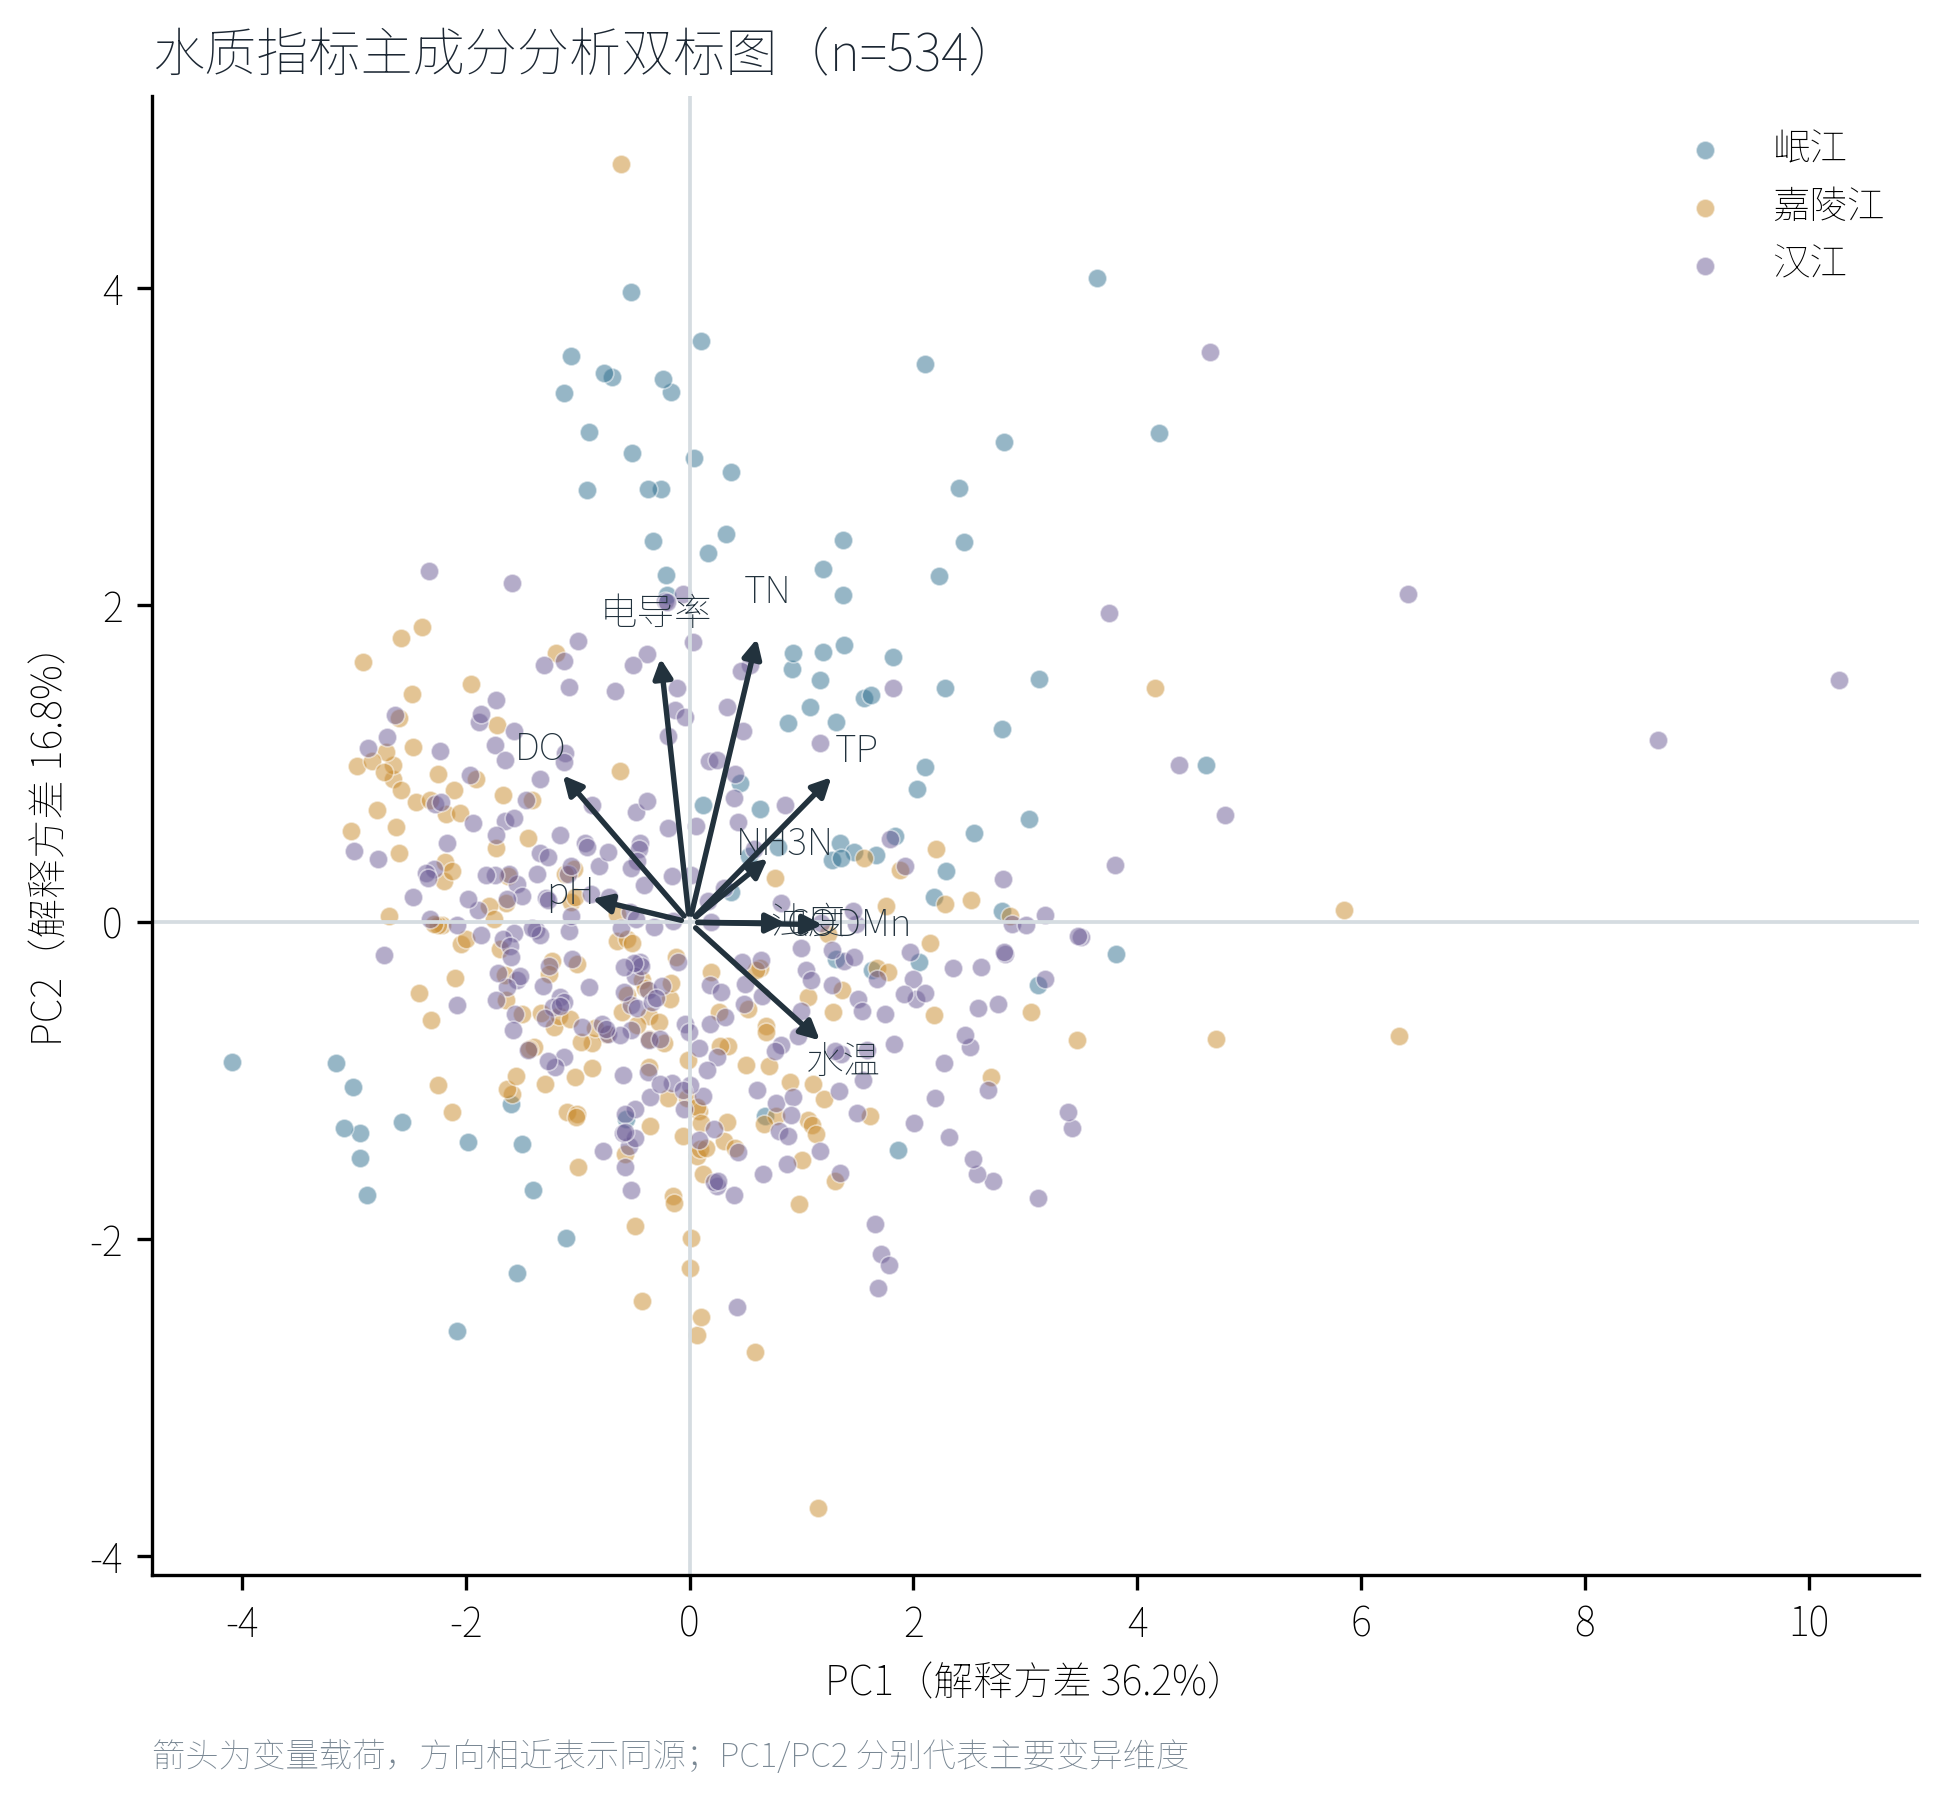
Fig. 8 | Principal component analysis biplot. PCA on nine standardised indicators. PC1 and PC2 cumulatively explain 53.0% of the variance. Arrows indicate indicator loadings; points are station-quarter observations coloured by river. The Han River is skewed toward the sediment axis (turbidity, TP), the Min River toward the dissolved-solute axis (TN, conductivity).
Discussion
The nitrogen assessment gap: a systemic blind spot
Our analysis provides the first systematic, high-frequency, multi-river quantification of what we term the nitrogen assessment gap in China’s surface-water quality framework. The 90-percentage-point divergence between the official five-indicator good-quality rate (99.1%) and the TN-inclusive rate (8.3%) is not a measurement error but a structural consequence of excluding TN from river classification. Because TN limits in GB3838-2002 were calibrated for lakes and reservoirs, where nitrogen residence times are longer and internal loading is significant, they are too strict for rivers—but no alternative river-specific TN limits have been established. The result is that riverine nitrogen pollution is effectively invisible in official water-quality statistics.
The practical implications are significant. Nitrogen is a primary driver of eutrophication, hypoxia and drinking-water contamination¹¹⁻¹². The Yangtze River delivers an estimated 1.5 Tg of nitrogen annually to the East China Sea¹³. By excluding TN from river assessment, the current framework creates a perverse incentive: local governments can meet water-quality targets without reducing nitrogen emissions, because nitrogen simply does not count. This may partially explain why phosphorus concentrations in Chinese rivers have declined in recent years while nitrogen concentrations have remained stubbornly high⁵. The Yangtze Economic Belt’s good-quality proportion rose from 67% in 2015 to 96.5%, but this improvement may not reflect equivalent nitrogen reduction.
Seasonal decoupling reveals source-specific dynamics
The near-complete absence of TN seasonality, juxtaposed with the strong seasonality of TP, turbidity and CODₘₙ, provides compelling evidence that nitrogen and phosphorus are governed by different dominant sources. The constant TN signal across seasons is consistent with continuous point-source discharges—domestic sewage, industrial effluent and nitrogen-enriched groundwater baseflow—which deliver nitrogen to rivers at relatively constant rates regardless of rainfall. The strong seasonality of TP, by contrast, points to rainfall-driven non-point-source mobilisation of particle-bound phosphorus from agricultural soils.
This source distinction has direct management implications. Phosphorus control in these rivers should focus on agricultural best-management practices, riparian buffer strips and sediment retention during the wet season. Nitrogen control, however, requires upgrading municipal wastewater treatment plants for biological nutrient removal, reducing industrial nitrogen discharges and managing agricultural nitrogen leaching into groundwater—interventions that operate on longer timescales and are largely independent of seasonal hydrology.
River-specific nutrient regimes require differentiated management
The TP–turbidity coupling gradient across the three rivers (Han ρ = 0.83 → Jialing ρ = 0.60 → Min ρ = 0.17) demonstrates that even neighbouring rivers within a single basin can operate under fundamentally different nutrient transport regimes. A uniform basin-wide nutrient management strategy would therefore be suboptimal. For the Han River, where phosphorus is sediment-bound and driven by non-point sources, measures such as conservation tillage, cover cropping and constructed wetlands would be most effective. For the Min River, where phosphorus is decoupled from sediment and likely point-source dominated, upgrading wastewater treatment and enforcing industrial discharge standards would yield greater returns. The Jialing River, with its intermediate regime, requires a hybrid approach.
This finding has broader relevance beyond China. Many river-basin management frameworks worldwide apply uniform nutrient criteria across diverse sub-basins, implicitly assuming similar source and transport regimes. Our results demonstrate that this assumption can be violated even within a single major basin, and that diagnostic analyses of nutrient–sediment coupling can guide the design of cost-effective, river-specific pollution-control strategies.
Limitations and future directions
Several limitations should be noted. First, our data span only four years (2021–2025), with the 2022 Yangtze basin drought as a potentially confounding extreme event; seasonal Mann–Kendall trend tests showed limited statistical power (22 of 170 station-indicator tests significant at P < 0.05; Fig. S4), so long-term trend conclusions should be drawn with caution. Second, without stable-isotope analysis (δ¹⁵N-NO₃, δ¹⁸O-NO₃) or land-use regression modelling, our source attribution is inferential rather than definitive; isotope-based source apportionment in the Jialing River has already identified nitrate sources¹⁰, and we recommend extending such analyses to all three rivers. Third, station coordinates in the public database are approximate and contain errors, so our spatial analysis uses longitudinal ordering rather than true georeferencing. Fourth, automatic-monitoring values for certain indicators (e.g., NH₃-N, with a reporting floor of 0.025 mg L⁻¹) may differ systematically from laboratory reference methods.
Despite these limitations, the robustness of our core findings—the assessment gap, the seasonal decoupling and the river-specific TP–turbidity coupling—is supported by 141,504 independent hourly observations and validated against official categories. Establishing river-specific TN standards and conducting isotope-based source apportionment across the three rivers would be the logical next steps toward evidence-based nitrogen management in the Yangtze basin.
Methods
Data source
Hourly water-quality monitoring data were obtained from China’s National Surface Water Quality Automatic Monitoring Real-time Data Publishing System (https://szzdjc.cnemc.cn), operated by the China National Environmental Monitoring Centre. The dataset comprises 4,998 CSV snapshot files captured between June 2021 and March 2025, each containing the most recent hourly values for all national control sections. After deduplication by (section name, timestamp), 141,504 unique hourly records were retained for 37 sections across the three target rivers: Min River (6 sections), Jialing River (13 sections) and Han River (18 sections).
Nine indicators were available: water temperature (°C), pH (dimensionless), dissolved oxygen (DO, mg L⁻¹), conductivity (μS cm⁻¹), turbidity (NTU), permanganate index (CODₘₙ, mg L⁻¹), ammonia nitrogen (NH₃-N, mg L⁻¹), total phosphorus (TP, mg L⁻¹) and total nitrogen (TN, mg L⁻¹). Chlorophyll-a and algal density were present in the raw files but were mostly missing (>90%) for river stations and were excluded from analysis.
River affiliation and data cleaning
The raw data contain only a “watershed” field (e.g., Yangtze Basin), not a river name. River affiliation was assigned by matching section names to a station-coordinate lookup table whose river field was derived from administrative-region queries. Section names that were ambiguous (e.g., “Xiaohe” appears for both the Han River in Hubei and the Ganlong River in Chongqing) were disambiguated by province, removing 4,306 misattributed records. Renamed sections (e.g., “Yibin Liangjianggou” / “Liangjianggou”) were counted as one physical section, yielding 37 unique sections.
Timestamp parsing prioritised the in-table “monitoring time” field; for 321 records with unparseable timestamps, the file-download timestamp was used as a fallback. Values recorded as “–” (instrument maintenance) or “*” (not measured) were treated as missing and excluded from means, not set to zero. A total of 189 physically implausible isolated spikes (primarily DO > 20 mg L⁻¹, 0.13% of records) were identified but retained, because their removal changed zero of 545 station-quarter water-quality categories.
Quarterly aggregation and water-quality classification
Section-quarter means were computed as the arithmetic mean of all valid hourly values within each calendar quarter (Q1: Jan–Mar, Q2: Apr–Jun, Q3: Jul–Sep, Q4: Oct–Dec). The median number of valid records per section-quarter was 315 (≈3.6 per day), with 36 section-quarters having fewer than 24 records. Water-quality categories were assigned by the single-factor method of GB3838-2002: each indicator was independently graded against the standard’s limits, and the worst grade determined the section-quarter category.
Two classification schemes were computed in parallel: (1) the river five-indicator standard (pH, DO, CODₘₙ, NH₃-N, TP), which is the official practice for rivers; and (2) the six-indicator standard (adding TN, using the lake-reservoir limits) as a sensitivity check. A station-quarter with all values missing for a given indicator had that indicator excluded from grading rather than counted as a failure.
Statistical analysis
Seasonal amplitudes were calculated as (max − min) / median × 100% across the four quarterly medians. Spearman rank correlations were computed between all indicator pairs on the section-quarter dataset. Principal component analysis (PCA) was performed on the correlation matrix of the nine standardised indicators (z-scores), with missing values replaced by the indicator median. Seasonal Mann–Kendall trend tests were conducted by combining observations from the same quarter across years to avoid conflating seasonality with trend. All analyses were conducted in Python (pandas, scipy, scikit-learn).
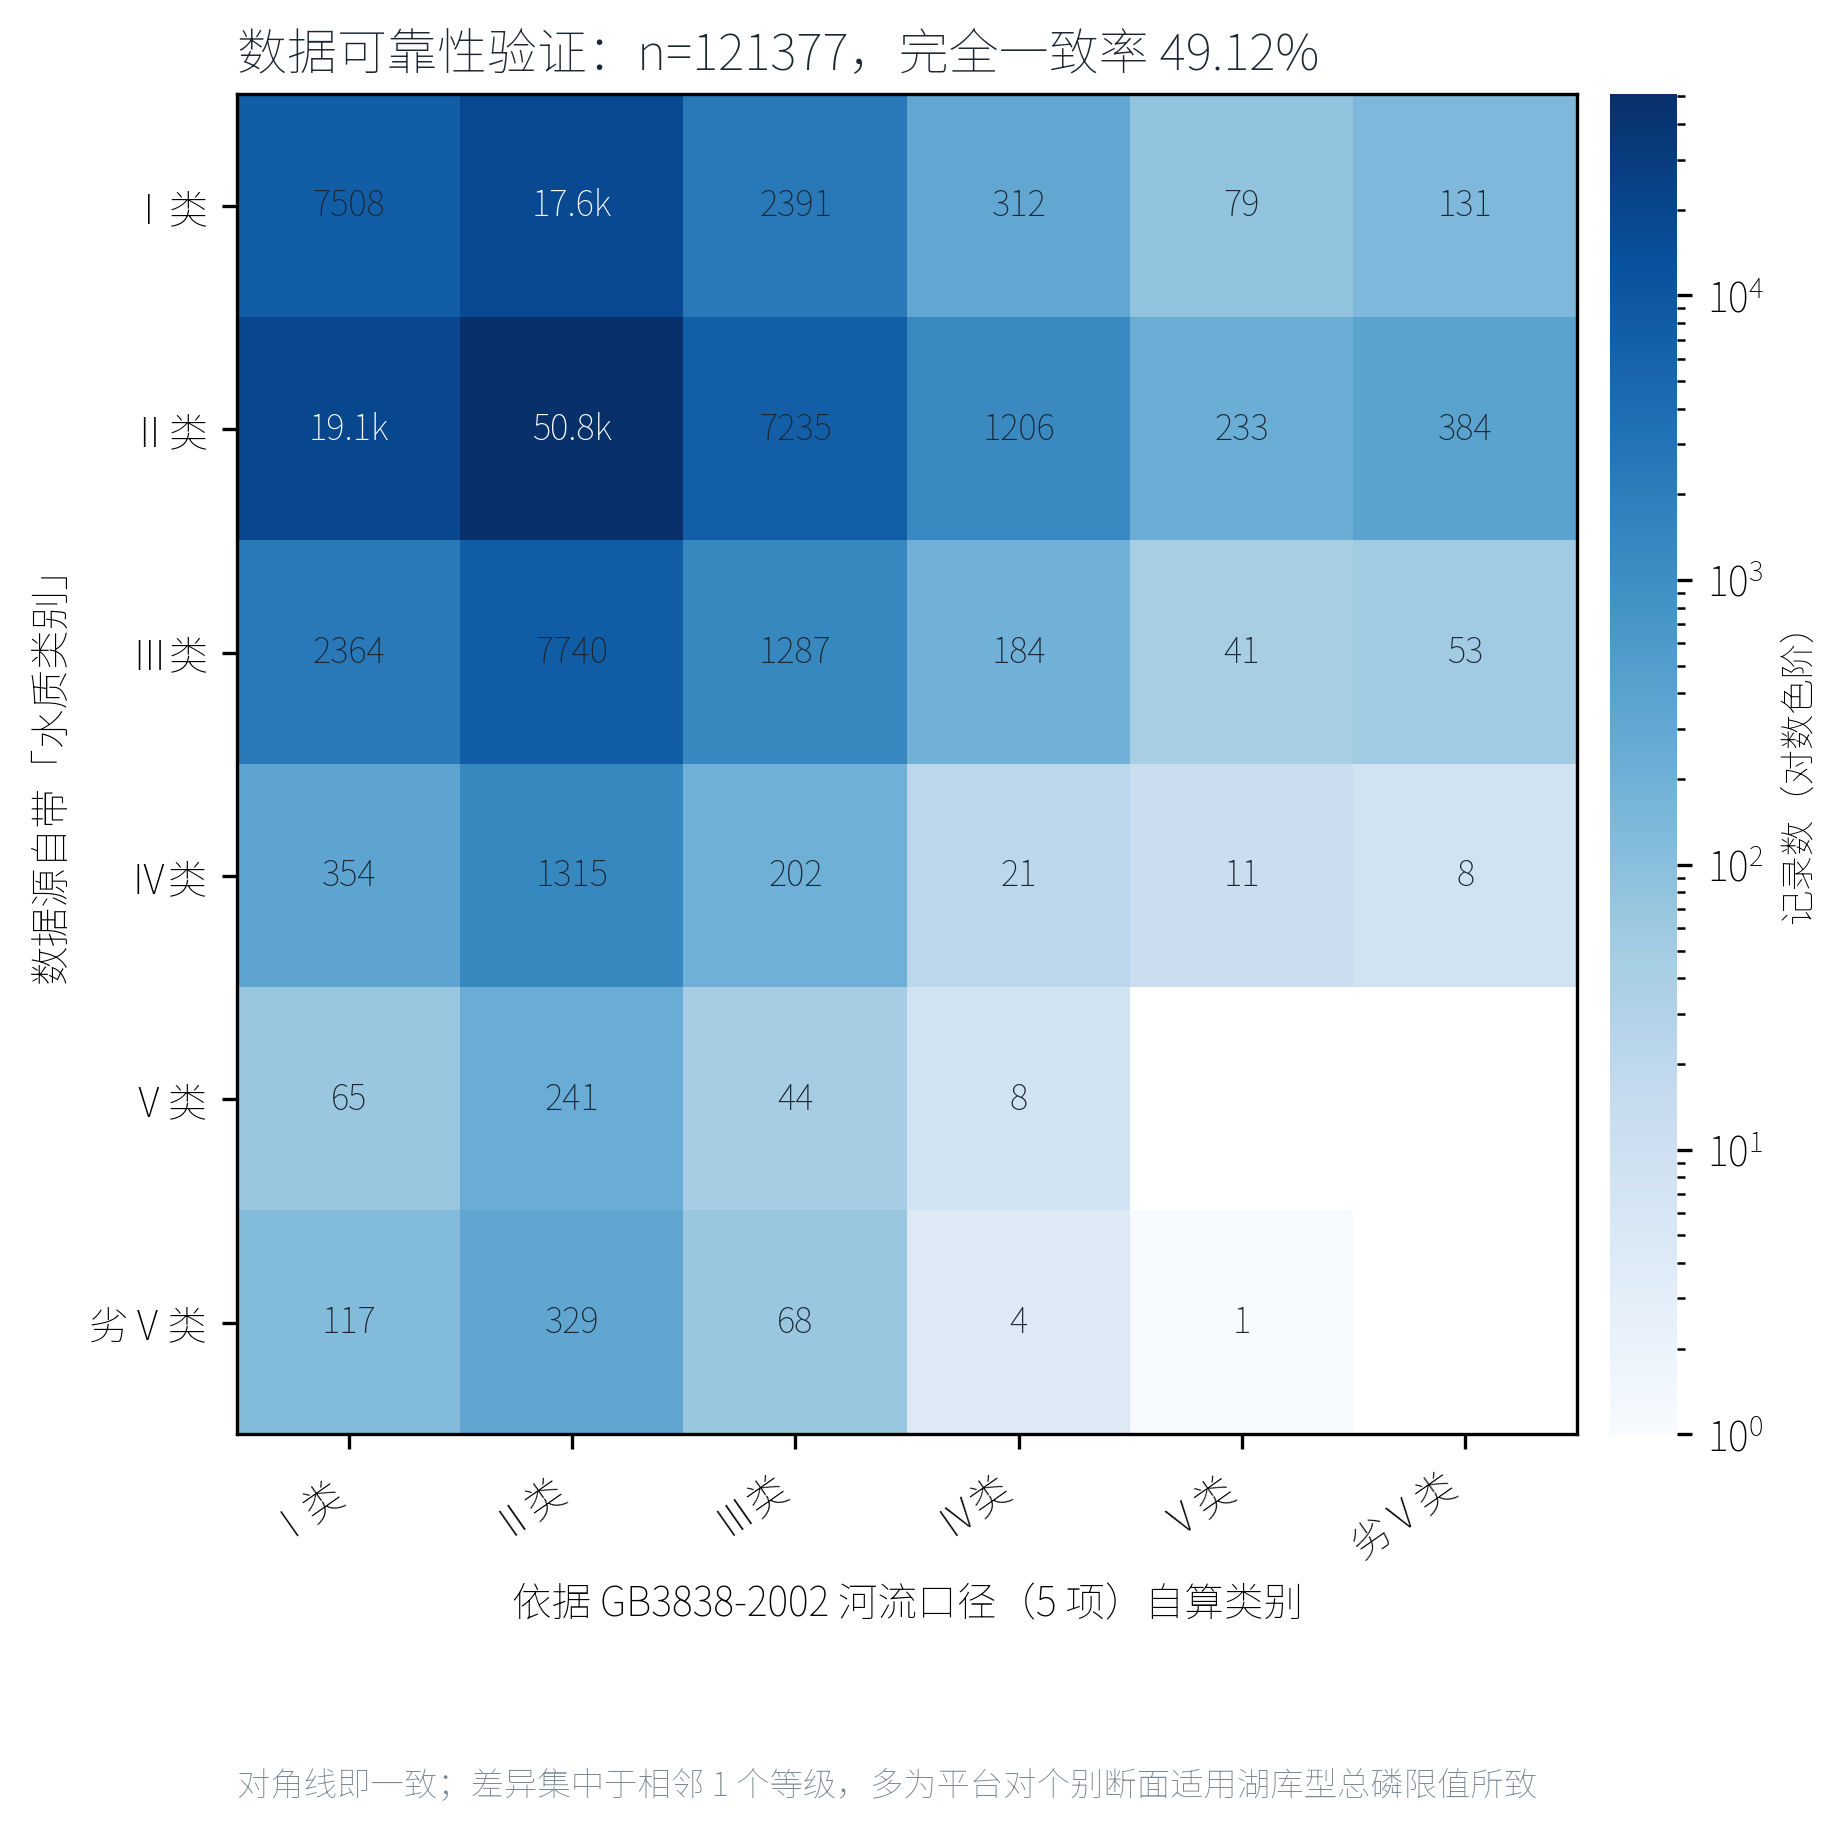
Fig. S2 | Validation of water-quality classification. Comparison between independently calculated categories and the official “water-quality category” field in the raw data. Agreement is 98.87% for the river five-indicator standard but only 2.74% for the TN-inclusive standard, confirming that official river assessment excludes TN.
Data availability
The water-quality monitoring data used in this study are publicly available from China’s National Surface Water Quality Automatic Monitoring Real-time Data Publishing System, operated by the China National Environmental Monitoring Centre (https://szzdjc.cnemc.cn:8070/GJZ/Business/Publish/Main.html). The system publishes hourly updated water-quality data for all national control sections. Raw data were downloaded as periodic CSV snapshots between June 2021 and March 2025; the complete dataset comprises 4,998 snapshot files. After deduplication and filtering to the three target rivers (Min, Jialing, Han), 141,504 unique hourly records were retained. Processed data tables (river-quarter summaries and station-quarter details) are provided as Supplementary Tables S1 and S2. The PCA loadings and seasonal Mann–Kendall trend test results are provided as Supplementary Tables S3 and S4. The station-coordinate lookup table used for river affiliation is available from the authors upon request. Code for data processing and statistical analysis is available from the corresponding author upon reasonable request.
References
-
Ministry of Ecology and Environment of the People’s Republic of China. 2024 Report on the State of the Ecology and Environment in China. (MEE, 2025). Available at: https://english.mee.gov.cn/Resources/Reports/soe/SOEE2019/202509/P020250930547851046686.pdf
-
General Administration of Quality Supervision, Inspection and Quarantine of the People’s Republic of China & Standardization Administration of the People’s Republic of China. Environmental Quality Standard for Surface Water (GB 3838-2002). (China Standards Press, 2002).
-
Guangdong Provincial Department of Ecology and Environment. Why is total nitrogen not included in surface water quality assessment? (2023). Available at: https://gdee.gd.gov.cn/hjjc4249/content/post_4266659.html
-
Tong, Y. et al. Spatiotemporal patterns of nitrogen and phosphorus in the major rivers of China. Environ. Pollut. 294, 118686 (2022).
-
Yu, H. et al. Nitrogen and phosphorus in the Yangtze River basin: status, trends, and management implications. Sci. Total Environ. 851, 158268 (2022).
-
Chen, M. et al. Decoupling of phosphorus but not nitrogen from water-quality improvement in China’s rivers. Nat. Sustain. 7, 234–245 (2024).
-
Hu, W. et al. Spatiotemporal distributions of nutrients in the downstream from Gezhouba Dam in Yangtze River, China. Environ. Earth Sci. 67, 1189–1200 (2012).
-
Zhang, Q. et al. The Yangtze River conservation law: a new legal framework for river basin management in China. Water Policy 24, 841–856 (2022).
-
Liu, J. et al. Water-quality assessment of the Han River, water source for the Middle Route of China’s South-to-North Water Diversion Project. Sci. Total Environ. 772, 145019 (2021).
-
Li, S. L. et al. Sources and processes affecting nitrate in a dam-controlled subtropical river, Southwest China. Appl. Geochem. 35, 118–127 (2013).
-
Glibert, P. M. et al. The role of nitrogen in eutrophication: a global perspective. Biogeochemistry 114, 3–19 (2013).
-
Qu, H. et al. Long-term changes in nitrogen and phosphorus delivery from the Yangtze River to the East China Sea. Water Res. 232, 119704 (2023).
-
Chen, X. et al. Nitrogen export from major Chinese rivers to the coastal ocean: a synthesis. Glob. Biogeochem. Cycles 33, 786–802 (2019).
Supplementary Information
Supplementary Table S1 | River-quarter water-quality summary (river five-indicator standard)
Summary of water-quality category proportions by river, year and quarter. Full table (60 rows, including both the five-indicator and TN-inclusive standards) is provided in the Supplementary Data file 表1_河流季度水质汇总_不含总氮.csv.
| River | Year | Qtr | N sects | I% | II% | III% | IV% | V% | Good% |
|---|---|---|---|---|---|---|---|---|---|
| Min | 2021 | Q2 | 5 | 20.0 | 40.0 | 40.0 | 0.0 | 0.0 | 100.0 |
| Min | 2021 | Q3 | 5 | 20.0 | 60.0 | 20.0 | 0.0 | 0.0 | 100.0 |
| Min | 2022 | Q2 | 6 | 16.7 | 0.0 | 83.3 | 0.0 | 0.0 | 100.0 |
| Jialing | 2021 | Q2 | 13 | 30.8 | 46.2 | 15.4 | 7.7 | 0.0 | 92.3 |
| Han | 2021 | Q2 | 18 | 5.6 | 88.9 | 0.0 | 0.0 | 5.6 | 94.4 |
… (full 60-row table available in Supplementary Data)
Supplementary Table S2 | Station-quarter water-quality detail (sample)
Full table contains 545 rows with six indicator quarterly means and water-quality categories under both standards. Provided in 表2_断面季度水质明细.csv. Sample rows shown below.
| River | Section | Year | Qtr | N | pH | DO | CODMn | NH3N | TP | TN | Cat(5) |
|---|---|---|---|---|---|---|---|---|---|---|---|
| Jialing | Shangshipan | 2021 | Q2 | 17 | 7.86 | 8.94 | 2.82 | 0.029 | 0.010 | 1.78 | II |
| Jialing | Shangshipan | 2022 | Q3 | 46 | 8.13 | 8.01 | 2.88 | 0.025 | 0.037 | 2.39 | II |
| Min | Yuebo | 2023 | Q2 | 463 | 7.98 | 7.52 | 1.95 | 0.041 | 0.073 | 1.92 | II |
… (full 545-row table available in Supplementary Data). Cat(5) = water-quality category under the river five-indicator standard.
Supplementary Table S3 | PCA component loadings
Loadings of the nine standardised indicators on the first two principal components. PC1 and PC2 cumulatively explain 53.0% of the total variance.
| Indicator | PC1 loading | PC2 loading |
|---|---|---|
| pH | -0.314 | 0.053 |
| Dissolved oxygen | -0.393 | 0.322 |
| Permanganate index | 0.421 | -0.005 |
| Ammonia nitrogen | 0.252 | 0.145 |
| Total phosphorus | 0.440 | 0.318 |
| Total nitrogen | 0.207 | 0.613 |
| Water temperature | 0.407 | -0.260 |
| Conductivity | -0.089 | 0.572 |
| Turbidity | 0.311 | -0.002 |
PC1 is dominated by turbidity, TP, CODₘₙ and water temperature (positive) and DO (negative), representing the sediment–organic-matter axis. PC2 is dominated by TN and conductivity, representing the dissolved-solute axis.
Supplementary Table S4 | Seasonal Mann–Kendall trend test (significant results, P < 0.05)
Of 170 station-indicator tests, 22 were significant at P < 0.05. Full results in 附表_季节性MannKendall趋势检验.csv. Significant results are listed below.
| River | Section | Indicator | n | Sen slope | Slope (%/qtr) | Z | P |
|---|---|---|---|---|---|---|---|
| Min | Weimenqiao | NH₃-N | 16 | -0.0025 | -7.96 | -2.89 | 0.004 |
| Min | Pengshan Bridge | CODₘₙ | 16 | -0.109 | -4.66 | -2.21 | 0.027 |
| Min | Pengshan Bridge | NH₃-N | 16 | -0.023 | -29.9 | -3.23 | 0.001 |
| Min | Yuebo | CODₘₙ | 16 | 0.139 | 8.40 | 2.21 | 0.027 |
… (22 significant results of 170 tests; full table available in Supplementary Data). Sen slope is in original units per quarter; slope (%/qtr) is relative to the section-indicator mean. Negative slopes indicate decreasing trends.
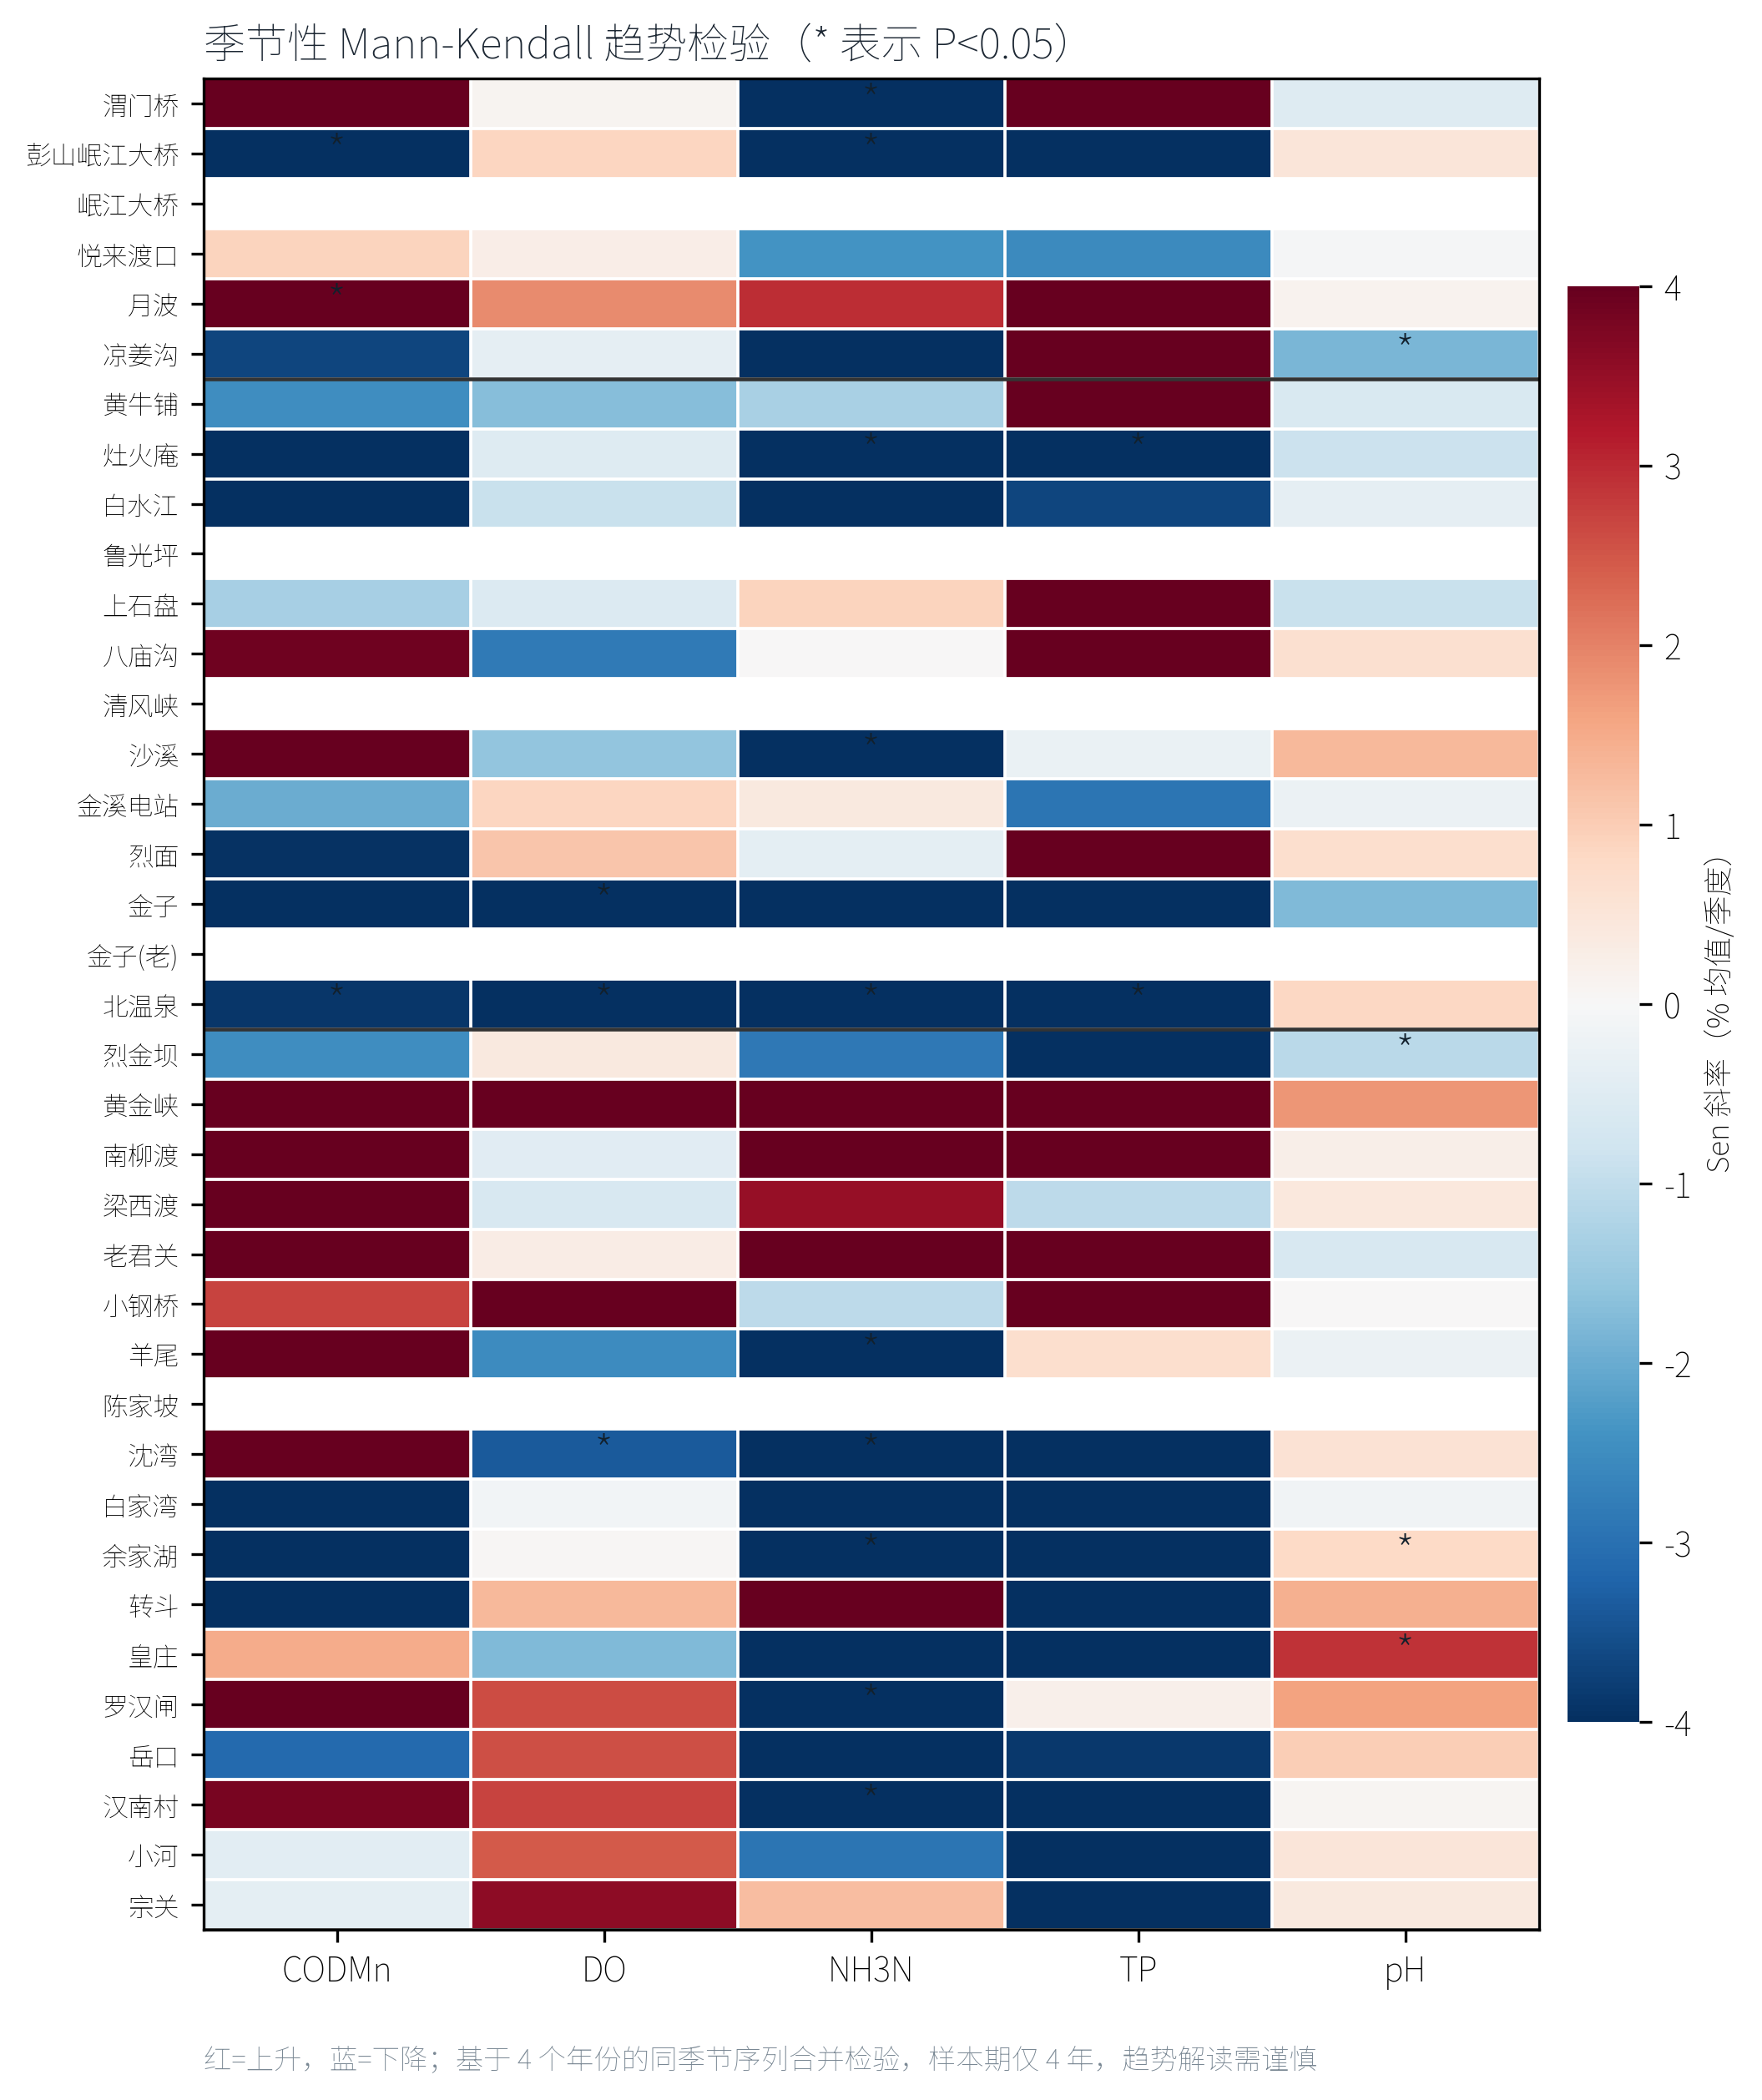
Fig. S4 | Seasonal Mann–Kendall trend test results. Of 170 station-indicator tests, only 22 were significant at P < 0.05 (shown in colour). The 4-year record and the 2022 Yangtze drought limit trend-detection power, so long-term trend conclusions should be drawn with caution.